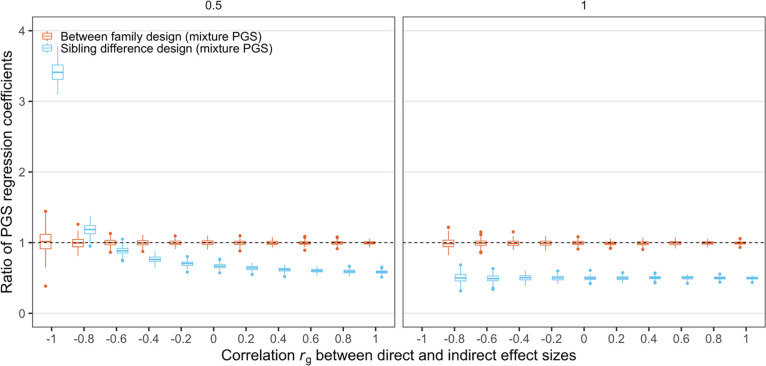
Fig 4. The effect of correlation rg between the direct and indirect effect sizes on PGS regression coefficients from different study designs.
y-axis shows the ratio of the PGS regression coefficients from between family design (red) or sibling difference design (blue) vs. 1, which is the effect size of the PGSdir (see Table 1). We used the same simulation settings as those used in Fig 3. Since we set the variance of the direct effect size , when the variance of the indirect effect size is also 1 and their correlation is -1, the direct and indirect effect sizes become exactly the opposite of each other, therefore PGSmix = 0 and the linear regression cannot be run under this scenario. Therefore, we do not include results when and ρg = −1.

