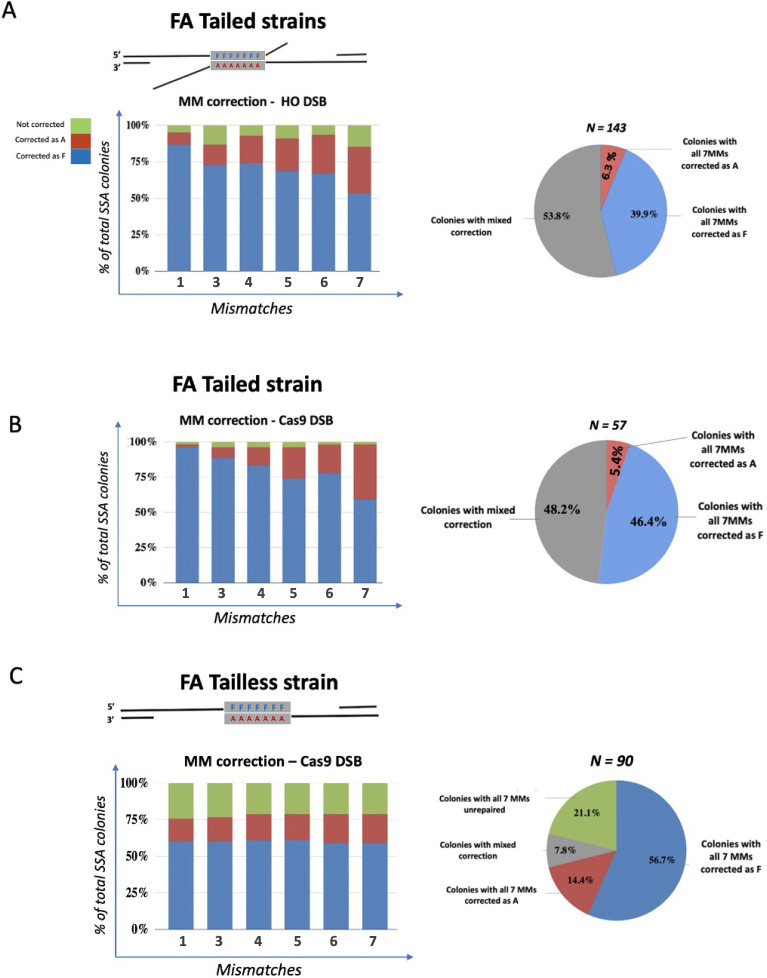
Fig 4. Sanger sequencing analysis of mismatch correction in FA Tailed and Tailless strains.
Left: the six columns from the chart correspond to the repair of each MM except MM2 and represent the percentage of survivors that repaired a mismatch as A (red), as F (blue) or remained unrepaired (green). Right: overall distribution of SSA repair outcomes. A. Induction of SSA by expression of HO endonuclease. B. Induction of SSA after constitutive induction of Cas9 (pAB101) at DSB-1. C. Spectrum of repair products in the GAL::CAS9-induced FA Tailless strain.

