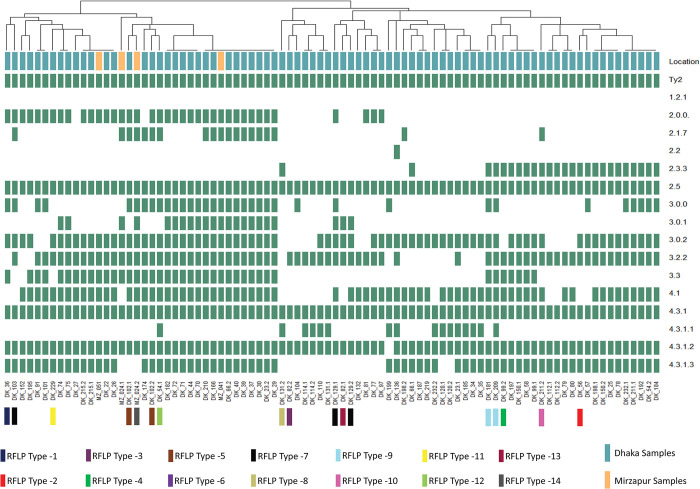
Fig 2. Hierarchical clustering of the activity spectra of the 86 bacteriophages isolated in the study.
All isolated phages were spotted on Salmonella Typhi isolates belonging to different genotypes (Y-axis) circulating in Bangladesh. Green represents activity/plaque formation, white represents no activity/no plaque formation. The phages on the X-axis are labelled based on the site of isolation. Phages from Mirzapur are labelled as MZ, and From Dhaka are labelled as DK. Multiple phages isolated from the sample are indicated with .1 and .2 at the end of the label. The heatmap was made using the R package gplots. The RFLP types determined by digestion with XbaI/NheI are also shown. Attenuated Salmonella Typhi strain Ty2, BRD948, is denoted as Ty2.

