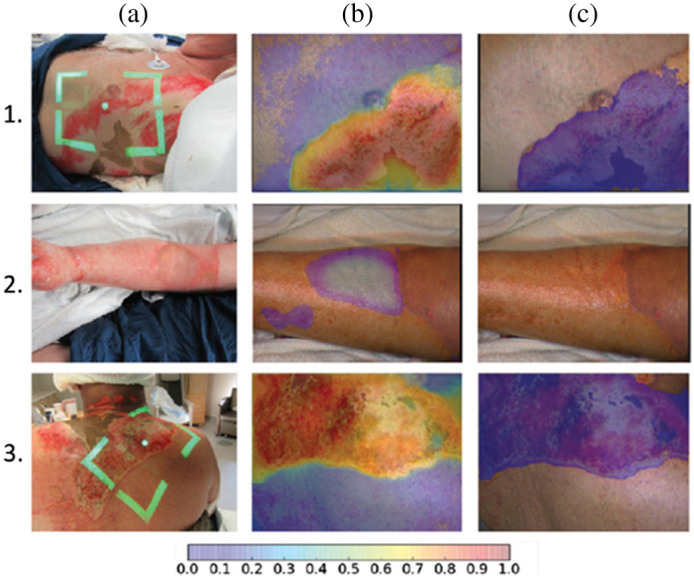
Fig. 4.

Tissue classification results using multispectral imaging data to train CNN. (a) Digital color images from three burn patients. The patients in Rows 1 and 3 had severe burns; the patient in Row 2 had a superficial burn. (b) A probability map of burn severity, where purple/blue colors represent a low probability of a severe burn and orange/red colors denote a high probability of a severe burn. The clear-appearing region in the middle of burn (2b) represents a set of pixels with probability < 0.05 of severe burn. (c) A segmented probability map in which purple pixels denote a probability of severe burn that exceeds a user-defined threshold. The algorithm performed well at correctly identifying the two severe burns and distinguishing them from the superficial burn (reproduced from Ref. 55, with permission).
