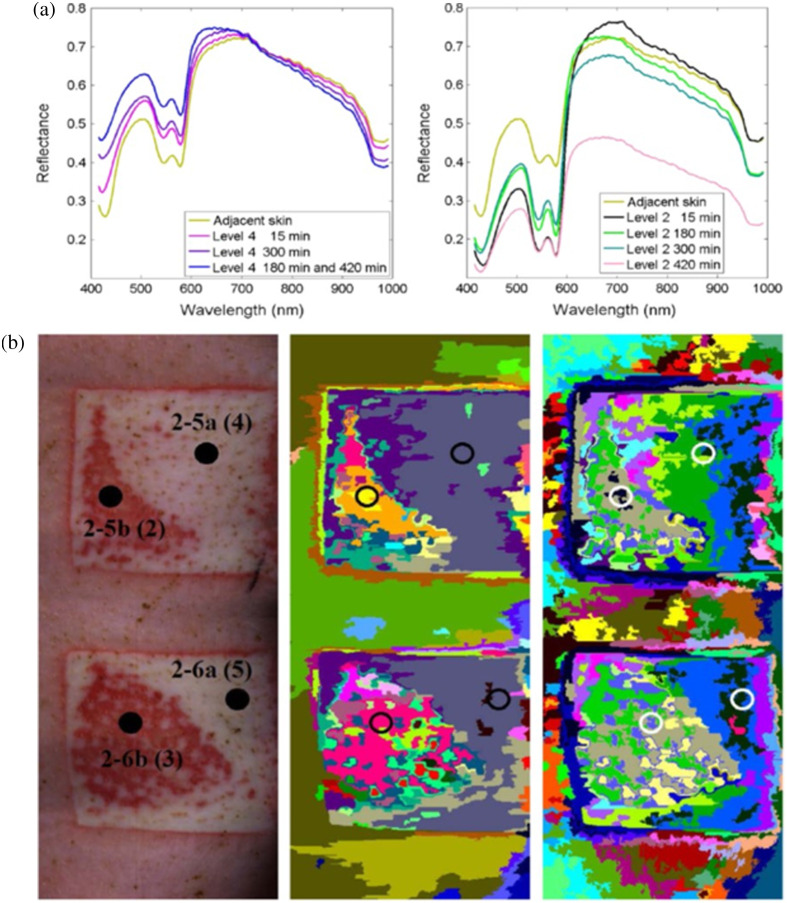
Fig. 5.
Classification of burn severity using hyperspectral imaging data. (a) Notable differences are seen in the 400 to 600 nm range of the reflectance spectra of more severe burns (Level 4) and less severe burns (Level 2) in a porcine model. These differences are likely attributable to changes in the concentration of hemoglobin (which strongly absorbs light in this wavelength regime) due to different levels of damage to the tissue vasculature. (b) Different burn severities (left column) are classified using two different segmentation algorithms: a spectral-spatial algorithm (center column) and a K-means algorithm (right column) (adapted from Ref. 56, with permission).

