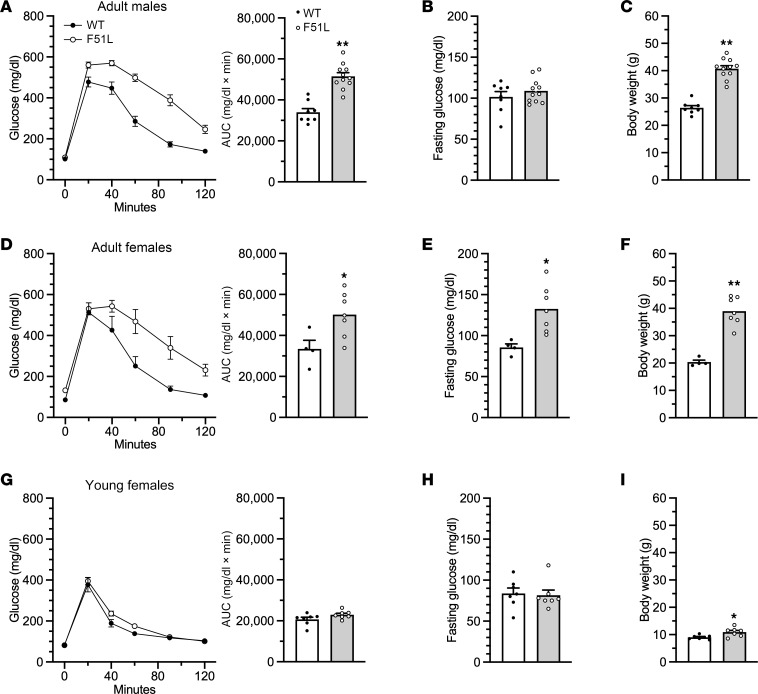
Figure 4. Glucose metabolism in MC4RF51L mice.
(A–C) Glucose metabolism in 6- to 7-month-old male MC4RF51L and WT mice (n = 8–11/group). Glucose tolerance test with AUC shown on the right (A), fasting glucose levels (B), and body weights at the time of glucose tolerance tests (C). (D–F) Glucose metabolism in 6- to 7-month-old female MC4RF51L and WT mice (n = 4–7/group). Glucose tolerance test with AUC shown to the right (D), fasting glucose levels (E), and body weights at the time of glucose tolerance tests (F). (G–I) Glucose metabolism in 4- to 5-week-old female MC4RF51L and WT mice (n = 7/group). Glucose tolerance test with AUC shown on the right (G), fasting glucose levels, (H) and body weights at the time of glucose tolerance tests (I). Data represent mean ± SEM. *P < 0.05, **P < 0.01 vs. WT by unpaired t tests.

