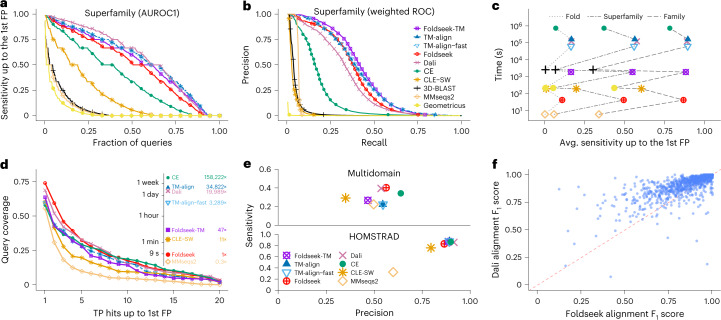
Fig. 2. Foldseek reaches similar sensitivities as structural aligners at thousands of times their speed.
a, Cumulative distributions of sensitivity for homology detection on the SCOPe40 database of single-domain structures. TPs are matches within the same superfamily; FPs are matches between different folds. Sensitivity is the area under the ROC (AUROC) curve up to the first FP (see Supplementary Fig. 4 for family and fold). b, Precision-recall curve of SCOPe40 superfamilies (see Supplementary Fig. 4 for family and fold). c, Average sensitivity up to the first FP for family, superfamily and fold versus total runtime on an AMD EPYC 7702P 64-core CPU for the all-versus-all searches of 11,211 structures of SCOPe40. d, Search sensitivity on multi-domain, full-length AlphaFold2 protein models. One hundred queries, randomly selected from AlphaFoldDB (version 1), were searched against this database. Per-residue query coverage (y axis) is the fraction of residues covered by at least x (x axis) TP matches ranked before the first FP match. e, Alignment quality for alignments of AlphaFoldDB (version 1) protein models (top panel), averaged over the top five matches of each of the 100 queries. Sensitivity = TP residues in alignment / query length; precision = TP residues / alignment length. Reference-based alignment quality benchmark on HOMSTRAD alignments. f, Alignment quality comparison between Foldseek and Dali for each HOMSTRAD family. The F1 score is the harmonic mean between sensitivity and precision.

