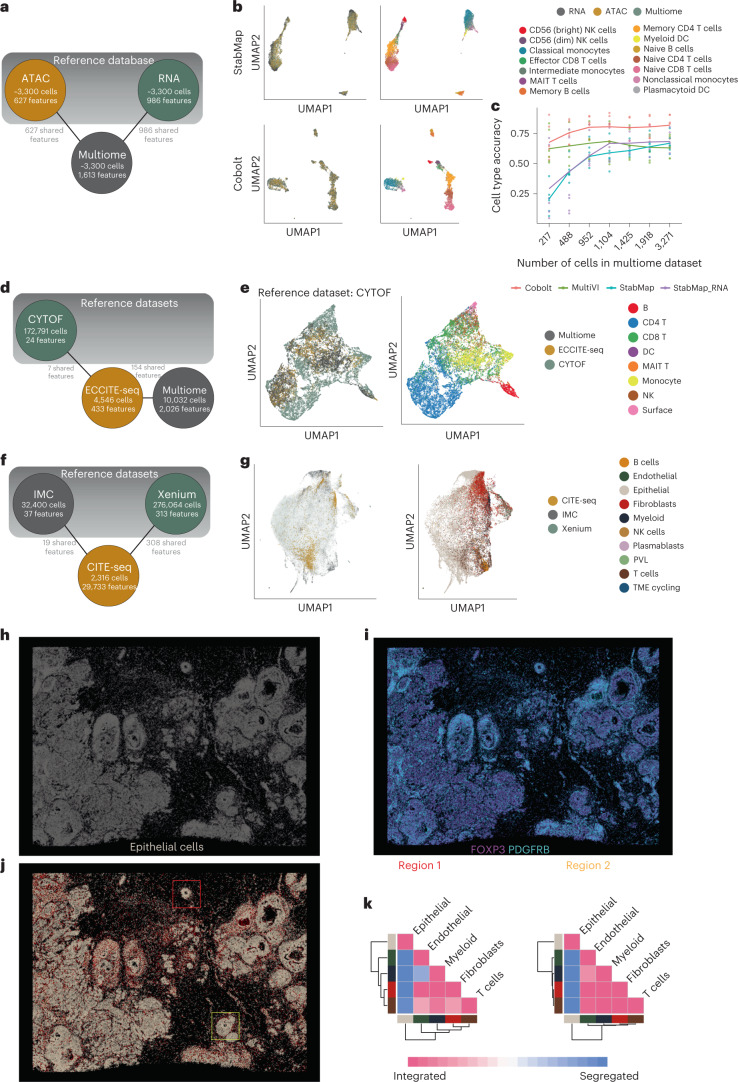
Fig. 3. Multi-hop mosaic data integration simulation and real data analyses.
a, Summary of mosaic data integration for PBMC Multiome simulation. Nodes present in the top shaded region are selected as reference datasets in the simulation. b, Joint two-dimensional embeddings generated using StabMap (first row, UMAP) and Cobolt (second row, UMAP), colored by simulated data type (left), and by cell type (right). c, Scatter plot displaying cell type accuracy (y axis) predicting ATAC-seq resolved cells using scRNA-seq-resolved cells as the training data, as the number of cells in the Multiome (x axis) increases. Each point corresponds to a simulation scenario and choice of multi-hop mosaic data integration method, including Cobolt, MultiVI, StabMap (default parameters) and StabMap_RNA (only RNA modality selected as reference). d, MDT of PBMC multiomics integration. Features are shared among the ECCITE-seq and CYTOF and Multiome datasets, respectively, but there are no shared features between the CYTOF and Multiome datasets. e, Joint UMAP embedding of multi-hop StabMap with CYTOF as the reference dataset, colored by data modality (left) and broad cell type (right). f, MDT of breast cancer spatial omics and multiomics integration. IMC and Xenium datasets are retained as reference datasets in this analysis. g, Joint UMAP embedding of StabMap colored by the data modality (left) and broad cell type (right). h, Spatial plot of Xenium-resolved cells in physical coordinates that are predicted to be epithelial using the IMC-resolved cells as training data. i, Spatial plot of Xenium-resolved cells in physical coordinates colored by imputed protein signal as measured from IMC-resolved data, for proteins PDGFRB (cyan) and FOXP3 (purple). j, Spatial plot of Xenium-resolved cells colored by predicted broad cell type using IMC-resolved cells as training data. Color legend is the same as in panel g. Two regions of interest are identified in red (region 1) and yellow (region 2) boxes, corresponding to a triple-positive receptor region and an invasive region, respectively. k, Cell–cell contact maps generated for the two regions according to broad cell type predicted value, indicating the degree of mixing of cells than expected by chance.

