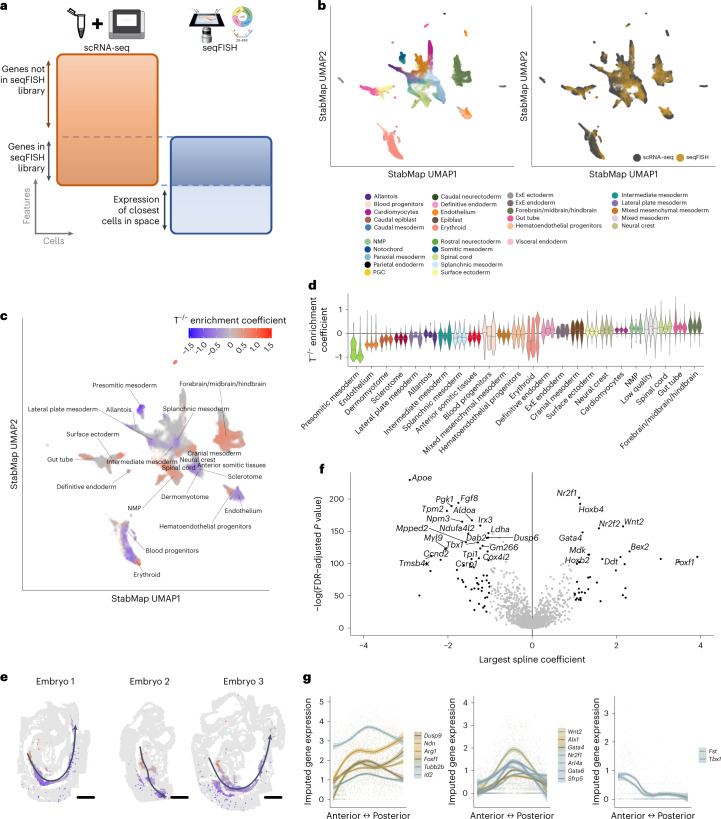
Fig. 4. Integration of T-chimera and seqFISH data using StabMap with spatial neighbor feature extraction.
a, Summary of mosaic data integration task and features used. Cells captured using scRNA-seq belonging to the E8.5 mouse gastrulation atlas1, WT/WT chimera1 and T−/−/WT chimera32. seqFISH cells are obtained from sagittal sections of three E8.5 embryos7. Features used for the scRNA-seq data are the union of the HVGs for each dataset. Features used for the seqFISH data are the gene expression of each cell, as well as the mean gene expression of the most proximal cells in space. b, UMAP plots displaying all cells after performing StabMap. Cells are colored by cell type (left) and by platform (right). c, UMAP plot of all seqFISH cells colored by local enrichment coefficient value of T−/− enrichment test for statistically significant tests. d, Violin plots of T−/− enrichment coefficients per embryo split by cell type. e, Spatial graphs of seqFISH embryos, with cells colored by T−/− coefficients for cells assigned a splanchnic mesoderm identity. Curved lines are fitted principal curves associated with the AP axis along each embryo. Scale bar, 150 μm. f, Volcano plot showing value of largest magnitude spline coefficient (x axis) and −log(FDR-adjusted P value) for likelihood ratio test of splines model for splanchnic mesoderm (Methods). Top 30 highly ranked genes with large spline coefficients above a magnitude of 1 are labeled. g, Scatter plots and local mean expression ribbons of clustered genes showing distinct patterns of expression along the AP axis in splanchnic mesoderm. Bands represent 95% confidence for loess smoothed fit. ExE endoderm = extraembryonic endoderm, PGC = primordial germ cells.

