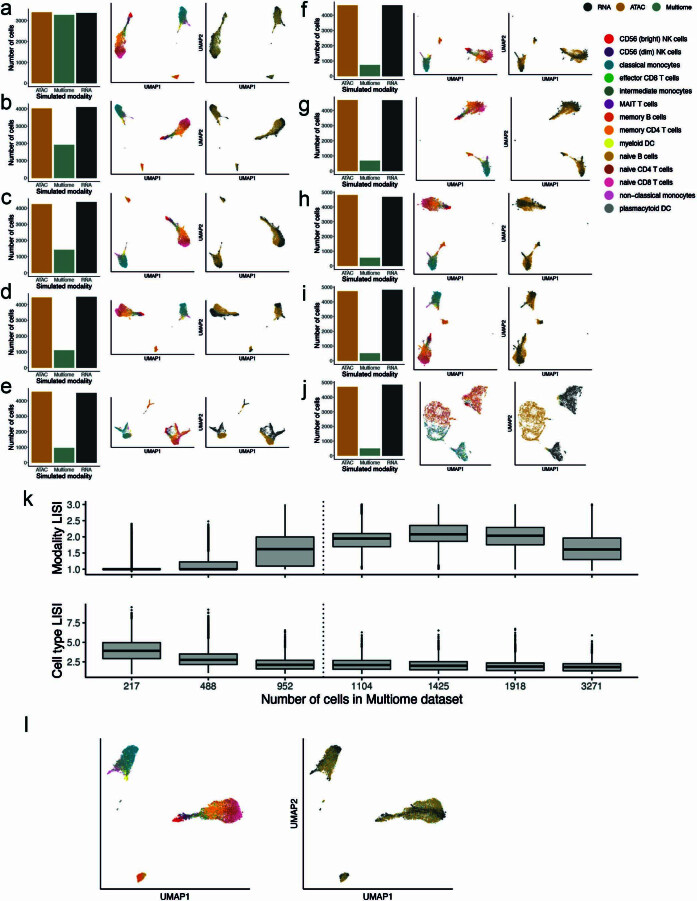
Extended Data Fig. 2. StabMap performance in 10X PBMC Multiome simulation.
a. Number of 10X PBMC Multiome cells assigned to each simulated data type (left), joint UMAP generated using StabMap coloured by simulated data type (middle), and by cell type (right). b-j. As in panel (a.) for decreasing proportions of simulated Multiome cells. k. Local inverse Simpson indices (LISI) for simulated data type (top row) and for cell type (bottom row). LISI values are extracted for all integrated cells (n = 10,032). Each boxplot (median bar and whiskers to quartiles) corresponds to different choices of number of cells in the multiome dataset. The dotted line indicates approximately 1,000 cells in the multiome dataset, where LISI values appear to markedly shift from unfavourable to favourable integration. l. Joint UMAP embedding generated using StabMap in simulation as described in Fig. 3, with RNA dataset selected as reference, indicating a ‘multi-hop’ data integration.

