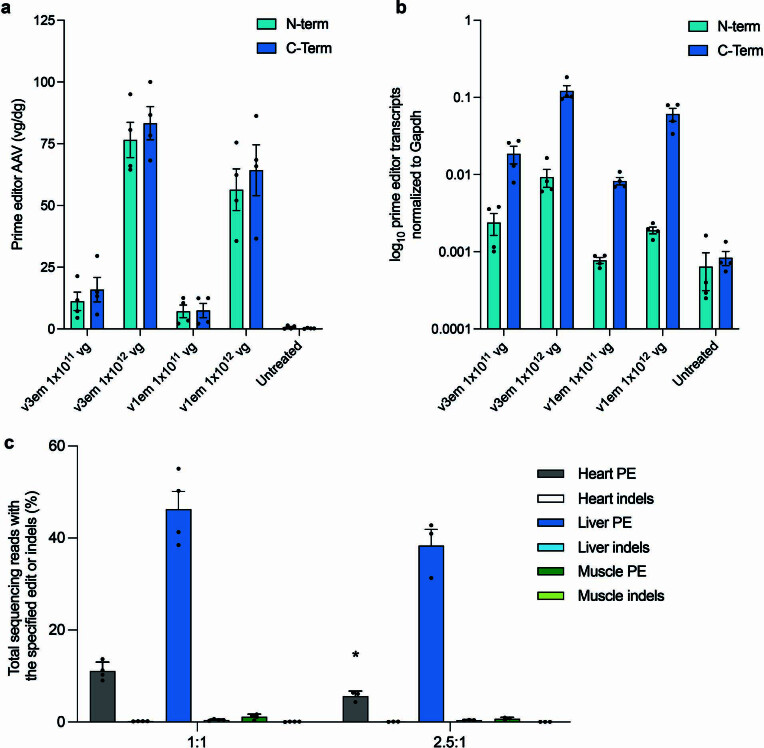
Extended Data Fig. 6. Transduction, RNA expression, and assessment of higher N:C ratio of PE-AAVs in liver.
a, In vivo comparison of viral genomes per diploid genome by promoter and dose in liver tissue. Prime editors were expressed from either the v3em (Cbh promoter) or v1em (EFS promoter) architecture at the doses indicated. Isolated DNA was quantified by ddPCR using primers and a probe specific to either the N- or C-terminal half of SpCas9. Viral genome concentrations were normalized to Gapdh. b, In vivo comparison of PE transcript levels by promoter and dose in liver tissue. Prime editors were expressed from either the v3em (Cbh promoter) or v1em (EFS promoter) architecture at the doses indicated. Mature mRNA transcripts were reverse transcribed, and PE transcript quantities from the resulting cDNA were measured by droplet digital PCR (ddPCR) using primers and a probe specific to either the N- or C-terminal half of SpCas9 (Supplementary Table 4). Transcript concentrations were normalized to Gapdh. c, In vivo comparison of higher ratio of N-terminal v3em PE-AAV to C-terminal half v3em PE-AAV. v3em PE3-AAV9 encoding the Dnmt1 +2 G-to-C edit was delivered at a total dose of 1×10¹² vg at the ratio indicated: either a ratio of 1:1 (5×10¹¹ vg each N- and C-terminal halves) or a ratio of 2.5:1 (7.1×10¹¹ vg N-terminal half and 2.9×10¹¹ vg C-terminal half) and bulk tissues were analyzed three weeks post injection by HTS. Dots represent individual mice and error bars represent mean±SEM of n = 3-4 different mice.

