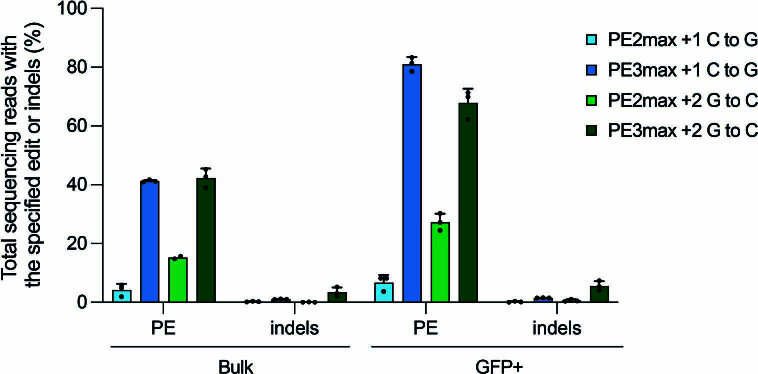
Extended Data Fig. 8. Comparison of PE2 and PE3 in vivo.
v1em AAV9 with an epegRNA encoding a +1 C-to-G edit or +2 G-to-C edit at Dnmt1 was delivered via P0 ICV injection at a dose of 1x10¹¹ vg (5x10¹⁰ vg each N- and C-terminal AAVs) with 1x10¹⁰ vg promoter-matched AAV9 EGFP:KASH. At three weeks, nuclei from cortex were isolated and sorted by FACS to either all nuclei (bulk) or GFP+ populations. Genomic DNA was extracted and analyzed by HTS. Dots represent individual mice (n = 2-4) and error bars represent mean±SEM of n = 3-4 mice.

