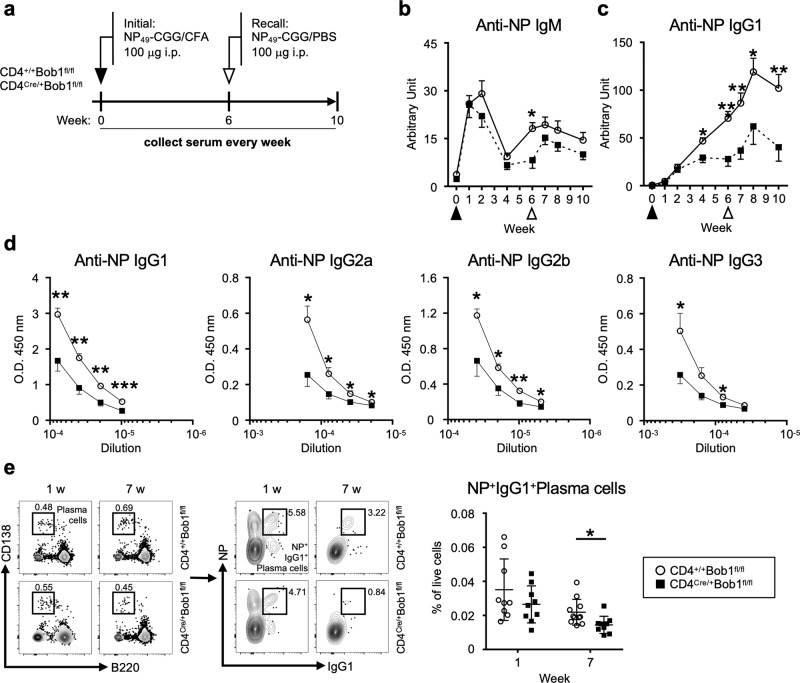
Fig. 1. Bob1 regulates Tfh cells to produce antigen-specific class-switched antibodies.
a Experimental protocol for the immunization of CD4Cre/+Bob1fl/fl mice and control CD4+/+Bob1fl/fl mice. NP49-CGG was administered intraperitoneally with CFA on day 0 and with PBS on day 42. Sera were collected from the tail vein every week until day 70 and examined by ELISA using NP27-BSA. b, c Time courses of NP-specific antibodies in sera. b NP-specific IgM, *P = 0.0148. c NP-specific IgG1, *P = 0.0207, **P = 0.0030, **P = 0.0070, *P = 0.0274, **P = 0.0070, in order from left to right. d Levels of NP-specific IgG subclasses in sera on day 49 as examined in different dilutions. NP-specific IgG1, **P = 0.0011, **P = 0.0011, **P = 0.0011, ***P = 0.0006; NP-specific IgG2a, *P = 0.0148, *P = 0.0148, *P = 0.0281, *P = 0.0221; NP-specific IgG2b, *P = 0.0499, *P = 0.0463, **P = 0.0096, *P = 0.0379; NP-specific IgG3, *P = 0.0499, *P = 0.0379, in order from left to right dilution points. e Representative flow cytometric profiles and graphs of NP+IgG1+ plasma cells (NP+IgG1+B220loCD138hi) in spleens. *P = 0.0132. Data represent the mean ± SEM in (b-d) or the mean ± SD in (e) in 8-11 mice per group. Statistical significance was analyzed by the Mann-Whitney U-test; *P < 0.05, **P < 0.01, ***P < 0.001. Data shown in (b-e) are from CD4+/+Bob1fl/fl mice (open circle) and CD4Cre/+Bob1fl/fl mice (closed square). Similar results were obtained across three independent experiments.

