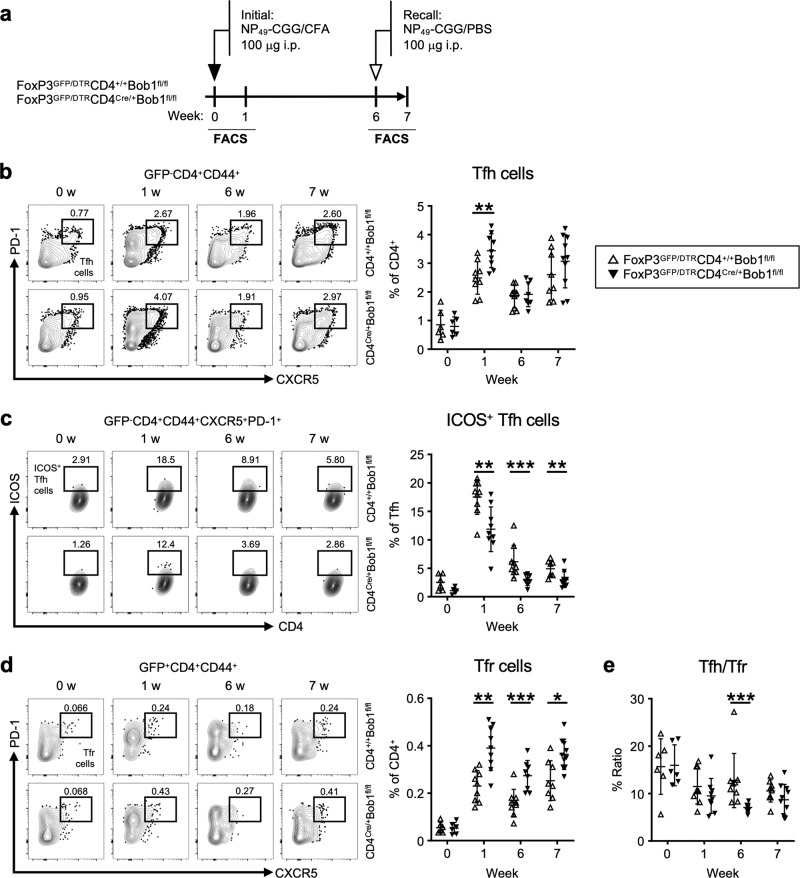
Fig. 2. Bob1 regulates the function of ICOS+ Tfh cells.
a Experimental protocol for immunization of FoxP3GFP/DTRCD4Cre/+Bob1fl/fl mice and FoxP3GFP/DTRCD4+/+Bob1fl/fl mice as controls. NP49-CGG was administered intraperitoneally with CFA on day 0 and with PBS on day 42. Spleen cells were analyzed by flow cytometry on days 0, 7, 42, and 49. b–d Representative flow cytometric profiles and graphs of CD4+ T cell subsets. b Tfh cells (GFP-B220-CD4+CD44+CXCR5+PD-1+), **P = 0.0040. c ICOS+ Tfh cells, **P = 0.0055, ***P = 0.0006, **P = 0.0092, in order from left to right in graphs of the % of ICOS+ Tfh cells among the total Tfh cells. d Tfr cells (GFP+B220-CD4+CD44+CXCR5+PD-1+), **P = 0.0014, ***P = 0.0009, *P = 0.0114, in order from left to right in graphs of the % of Tfr cells among the total CD4+ T cells. e Ratio of Tfh cells per Tfr cells based on the results from (b) and (d). ***P < 0.0003. Data represent the mean ± SD of 6–10 mice per group. Statistical significance was analyzed by the Mann-Whitney U-test; *P < 0.05, **P < 0.01, ***P < 0.001. Data in (b–d) are shown from FoxP3GFP/DTRCD4+/+Bob1fl/fl mice (open triangle) and FoxP3GFP/DTRCD4Cre/+Bob1fl/fl mice (closed triangle). Similar results were obtained across three independent experiments.

