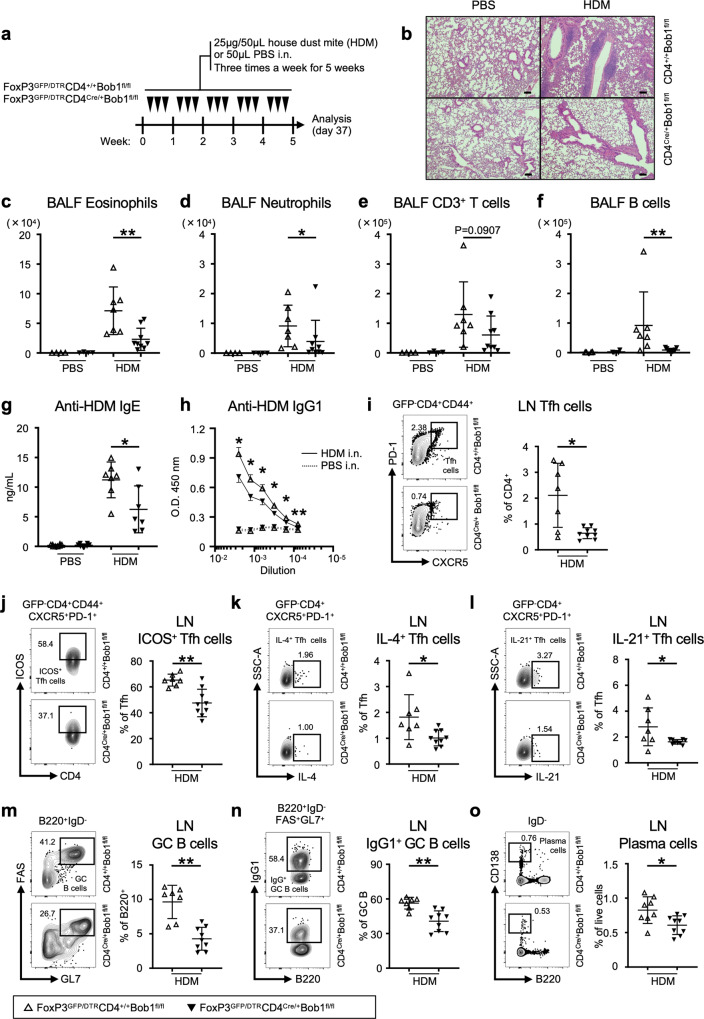
Fig. 6. Analysis of HDM-induced allergic asthma models.
a Experimental protocol for HDM exposure to FoxP3GFP/DTRCD4Cre/+Bob1fl/fl mice and control FoxP3GFP/DTRCD4+/+Bob1fl/fl mice. Mice were sensitized by the intranasal instillation of 25 μg HDM in 50 μL saline (PBS) or 50 μL saline alone as a control for 3 days per week consecutively for 5 weeks, before analysis on day 37. b Representative microscopy images of formalin-fixed paraffin-embedded tissue sections of pulmonary lesions on day 37 stained with hematoxylin and eosin. Scale bar: 100 μm. c–f Number of inflammatory and immune cells in the BALF on day 37 assessed by flow cytometry following the gating strategies shown in Supplementary Fig. 10. c Eosinophils (CD3-Gr-1-CD11b+CD11c-), **P = 0.0052. d Neutrophils (CD3-Gr-1+CD11b+CD11c-), *P = 0.0418. e CD3+ T cells (CD3+CD11c-MHCII-). f B cells (B220+CD3-Gr-1-CD11b-CD11c-MHC-II+), **P = 0.0033. g, h Serum levels of HDM-specific antibodies on day 37 assessed by ELISA. g Serum levels of HDM-specific IgE, *P = 0.0379. h Serum levels of HDM-specific IgG1 in different dilutions are indicated by solid lines. The levels were compared between FoxP3GFP/DTRCD4+/+Bob1fl/fl and FoxP3GFP/DTRCD4Cre/+Bob1fl/fl mice with statistics as indicated. *P = 0.0256, *P = 0.0256, *P = 0.0304, *P = 0.0455, *P = 0.0221, **P = 0.0030, in order from left to right. i–o Representative flow cytometric profiles and graphs of lymphocyte subsets within the mediastinal lymph nodes on day 37 assessed by flow cytometry following the gating strategies shown in Supplementary Fig. 5a, b. i Tfh cells (GFP-B220-CD4+CD44+CXCR5+PD-1+), *P = 0.0283. j ICOS+ Tfh cells, **P = 0.0052. k IL-4+ Tfh cells, *P = 0.0164. l IL-21+ Tfh cells, *P = 0.0287. m GC B cells (B220+IgD-FAS+GL7+), **P = 0.0012. n IgG1+ GC B cells, **P = 0.0012. o Plasma cells (B220loIgD-CD138hi), *P = 0.0222. Data represent the mean ± SD (c–g, i–o) or the mean ± SEM (h) of 4–9 mice per group. Statistical significance was analyzed by the Mann–Whitney U-test; *P < 0.05, **P < 0.01, ***P < 0.001. Data in (c–o) are shown for FoxP3GFP/DTRCD4+/+Bob1fl/fl mice (open triangle) and FoxP3GFP/DTRCD4Cre/+Bob1fl/fl mice (closed triangle). Similar results were obtained across three independent experiments. See also Supplementary Fig. 11.

