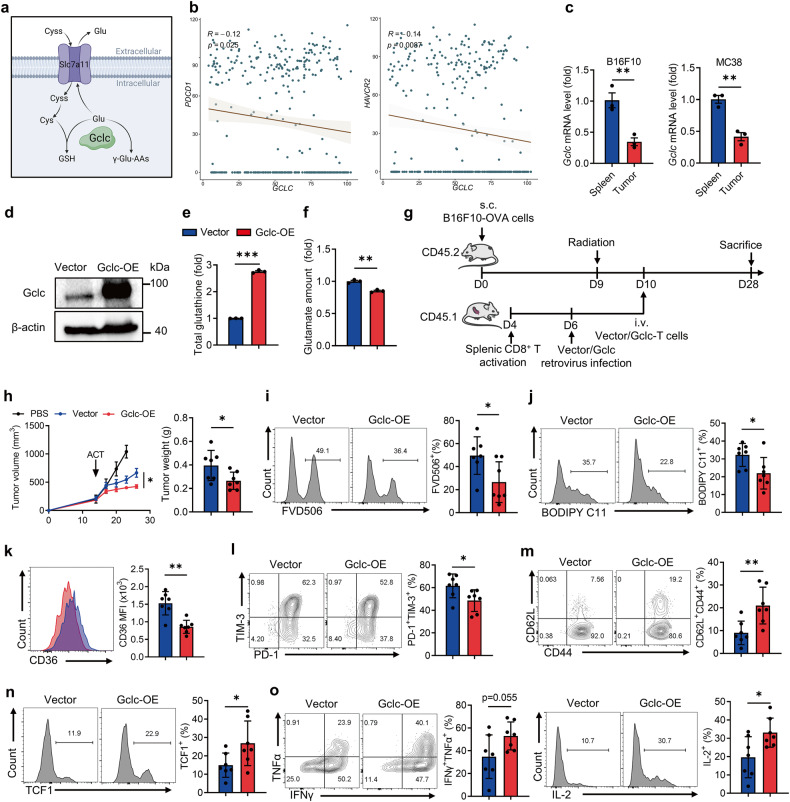
Fig. 7. Enforced Gclc expression in CD8+ T cells limits ferroptosis and boosts anti-tumor immunity.
a Diagram of Gclc’s dual role for consuming intracellular glutamate. b Correlation analysis of PDCD1, HAVCR2 and GCLC expression in tumor-infiltrating CD8+ T cells from melanoma patients (GSE120575 [56]). c RT-qPCR analysis of Gclc expression of CD8+ T cells from B16F10 and MC38 tumors and spleens (n = 3 per group). d Western blot assay of Gclc expression of the indicated T cells. e Quantification of total glutathione in vector and Gclc-OE T cells culturing in NM (n = 3 per group). f Glutamate content of vector and Gclc-OE T cells cultured in CD (n = 3 per group). g Diagram of adoptive transfer of vector and Gclc-OE T cells in B16F10-OVA tumors. h Tumor volume and tumor weight of the indicated groups (n = 7 per group). i, j The percentages of FVD506+ subset (i) and BODIPY C11+ subset (j) of the indicated tumor-infiltrating T cells. k CD36 expression of the indicated tumor-infiltrating T cells. l–o The percentages of PD-1+TIM-3+ subset (l), CD62L+CD44+ subset (m), TCF1+ subset (n), and the levels of cytokine secretion (o) of the indicated tumor-infiltrating T cells. Each symbol represents one individual. Data are mean ± s.e.m. p values are measured by two-tailed unpaired Student’s t test. *p < 0.05, **p < 0.01.

