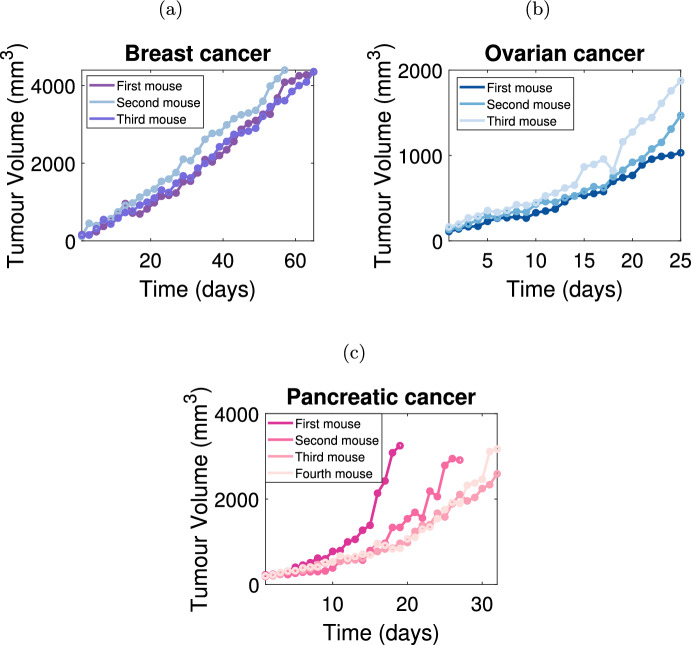
Fig. 1.
In vivo tumour volume measurements. Tumour growth is measured in vivo for a breast cancer cells () (Kim et al. 2011), b ovarian cancer cells () (Kim et al. 2011) and c pancreatic cancer cells () (Wade 2019; Wade et al. 2020). Each mouse is identified by a unique colour and the specific data measurements are represented by solid points. The ordering of the naming convention for the mice was chosen randomly. Pancreatic tumour datasets in (c) exhibit a potentially biphasic tumour growth pattern

