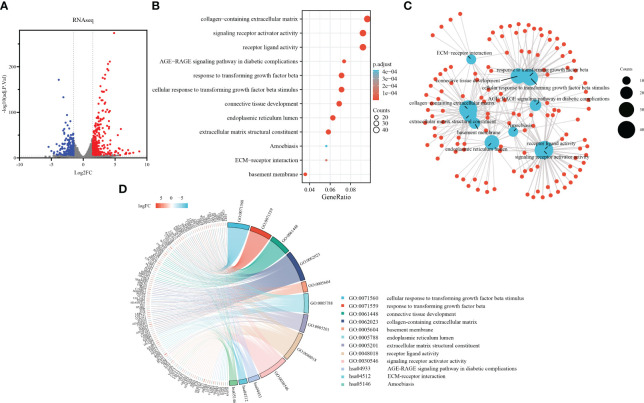
Figure 2.
Development of a TGF-β1 induced pulmonary fibroblast fibrosis model: DEGs identification and functional enrichment analysis. (A) Volcano plot displaying DEGs identified from RNA sequence data using the criteria adj.P.Val<0.0001, |log2FC|≥1.5, in which red points represent up-regulated genes, and blue points represent down-regulated. (B) Bubble chart presenting Gene Ontology (GO) and pathway enrichment analysis of RNAseq-DEGs. Bubble size indicates counts of respective GO category, and bubble color represents the adjusted p-value. (C) Functional network of enrichment analysis constructed by clusterProfiler, in which red points represent genes involved in similar functional GO terms or pathways. (D) Chord diagram illustrating functional relationships among RNAseq-DEGs and GO terms.

