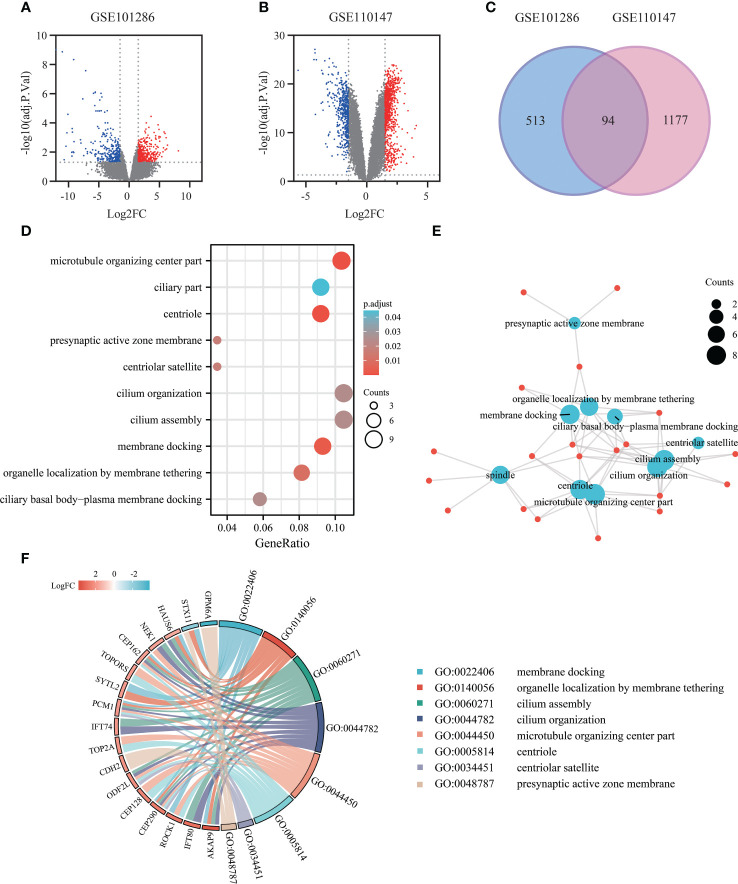
Figure 3.
Exploring gene expression profiles in pulmonary fibrosis tissue: DEGs identification and functional enrichment analysis. (A) Volcano plot of DEGs (adj.P.Val<0.05, |log2FC|≥1.5) in mRNA expression profiling dataset GSE101286. (B) Volcano plot of DEGs (adj.P.Val<0.05, |log2FC|≥1.5) in dataset GSE110147. (C) Venn diagram depicting the overlapping DEGs, with 94 genes representing the intersection between the GSE101286 and GSE110147 datasets. (D) Bubble chart presenting the Gene Ontology (GO) and pathway enrichment analysis of DEGs in the Microarray analysis. (E) Functional network of enrichment analysis constructed using clusterProfiler. (F) Chord diagram visualizing the functional relationships among the DEGs and GO terms, highlighting the enrichment results from the GEO datasets.

