Figure 5.
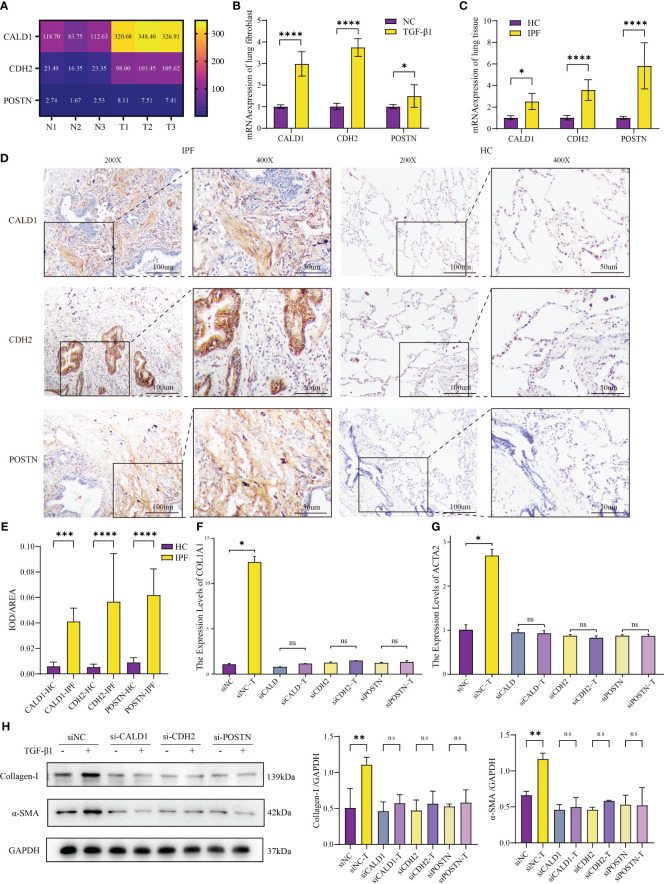
Validation of mRNA expression in IPF fibroblast model and human lung tissue. (A) Different mRNA levels of CALD1, CDH2 and POSTN in sequencing results. N1-N3: HLFs isolated from normal lung tissues adjacent to tumors; T1-T3: primary HLFs stimulated with recombinant human TGF-β1 (5 ng/ml) for 24 hours. (B) Comparison of CALD1, CDH2, POSTN mRNA expressions in HLFs between TGF-β1 group and normal control (NC) group. n=6 for each group. (C) mRNA expressions of CALD1, CDH2, POSTN in healthy control (HC) and IPF patients’ lung tissues measured by RT-qPCR. n=8 for each group. (D) Representative immunohistochemistry images and quantification (E) of CALD1, CDH2 and POSTN expression in lung fibrosis and normal lung tissues. n=8 for each group. Original magnification 200×, Scale bar 100 μm; Original magnification 400×, Scale bar 50μm. (F). RT-qPCR analysis of COL1A1 gene expression in lung fibroblasts treated with respective siRNA and TGF-β1. (G) Quantitative PCR analysis of ACTA2 gene expression in lung fibroblasts treated with respective siRNA and TGF-β1. n=3 for each group. (H) Representative western blot images and quantification of Collagen I and α-SMA expression in lung fibroblasts treated with respective siRNA and TGF-β1. *p< 0.05, **p < 0.001, ***p < 0.0001, and ****p < 0.00001, ns, not significant by Welch one-way ANOVA test, Error bars denote SD.

