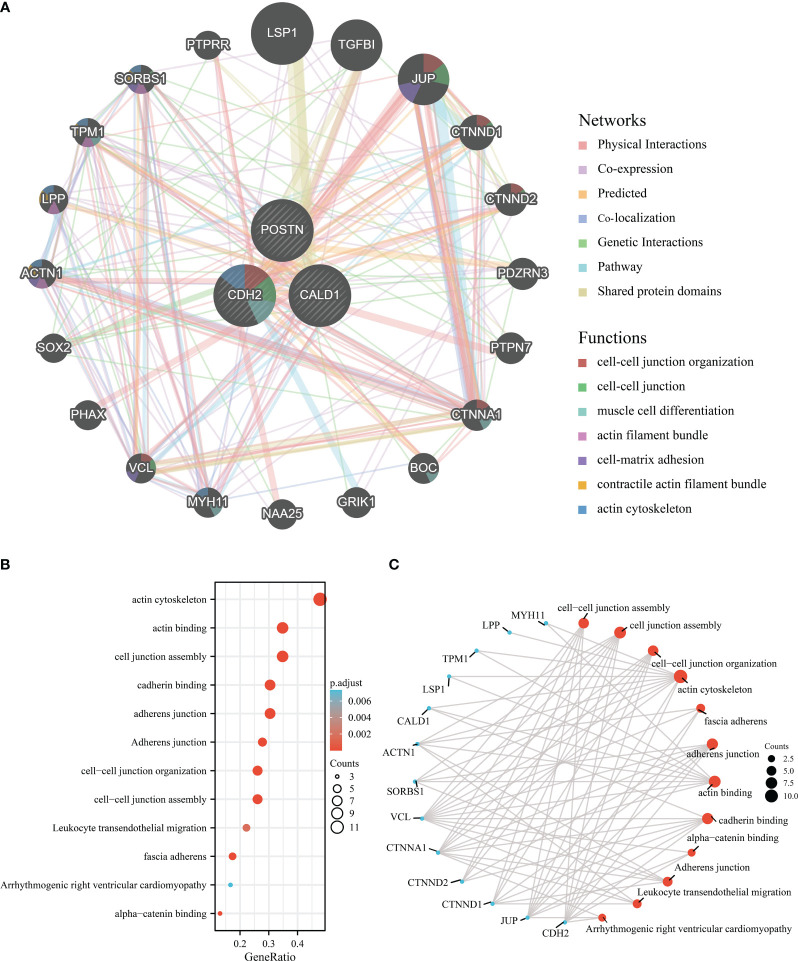
Figure 6.
Interaction analysis of the feature genes. (A) Gene-gene interaction network for DEGs analyzed using the GeneMANIA database. The 20 most frequently altered neighboring genes are shown as nodes, with node color representing gene function. (B) Enrichment analysis of GO and KEGG pathways related to the 23 genes mentioned above. (C) Functional network of enrichment analysis constructed to visualize connections and associations between different functional categories.

