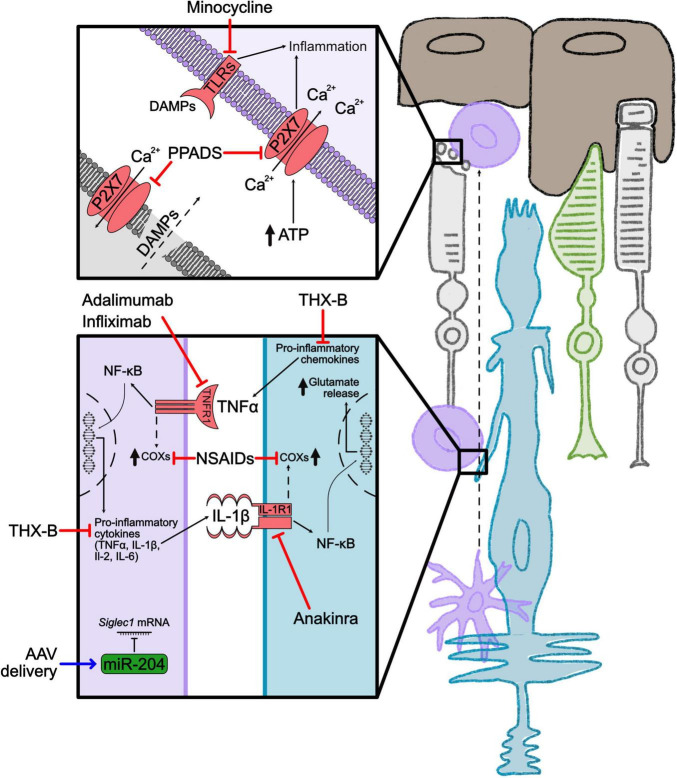
FIGURE 2.
Inflammation in RP and associated treatments. Schematic representation of the main inflammatory cells and cytokines in the degenerating retina. Cones are shown in green, rods in light gray, Müller glia in blue, microglia in violet and RPE in brown. Squares highlight cell-cell interplay in inflammation. Red lines indicate approaches to inhibit inflammatory mediators. The blue line indicates a gene therapy approach. Dashed arrows indicate indirect effects. ATP, adenosine triphosphate; AAV, adeno associated virus; COXs, cyclooxygenases; DAMPs, damage-associated molecular patterns; IL, interleukin; IL1R1, interleukin 1 receptor 1; miR-204, microRNA-204; NF-κB, nuclear factor kappa-light-chain-enhancer of activated B cells; NSAIDs, non-steroidal anti-inflammatory drugs; PPADS, pyridoxal-phosphate-6-azophenyl-2′,4′-disulfonic acid; P2X7, purinergic receptor P2X7; Siglec1, Sialic Acid Binding Ig Like Lectin 1; THX-B, 1,3-diisopropyl-1-[2-(1,3-dimethyl-2,6-dioxo-1,2,3,6tetrahydropurin-7-yl)-acetyl]-urea; TLRs, toll-like receptors; TNFα, tumor necrosis factor α, TNFR1, tumor necrosis factor receptor 1.

