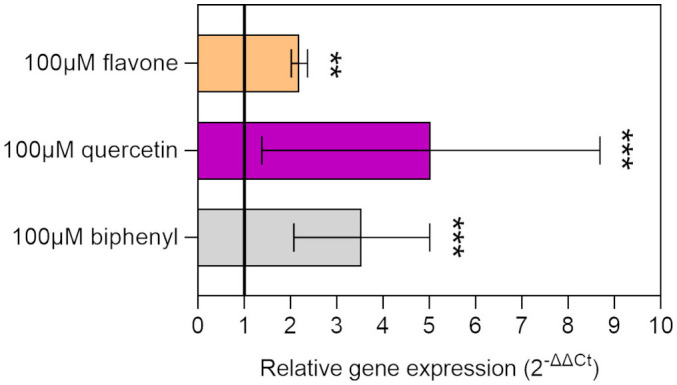
Figure 3.

Relative gene expression of the bphA gene in strain LB400 exposed to flavonoids. The relative gene expression of the bphA gene was quantified via RT-qPCR, using the 16S rRNA gene as a housekeeping gene. The results of the relative expression of bphA transcripts are expressed as ΔΔCt, indicating the average fold change over the non-induced control. The black line (relative gene expression value = 1) represents the baseline of gene expression in the non-induced control. Biphenyl was used as positive control. Error bars represent the standard deviation of three independent experiments. Statistical analysis was performed using Dunn’s post-hoc test and asterisks indicate significant differences from the control (**p ≤ 0.01, ***p ≤ 0.001).
