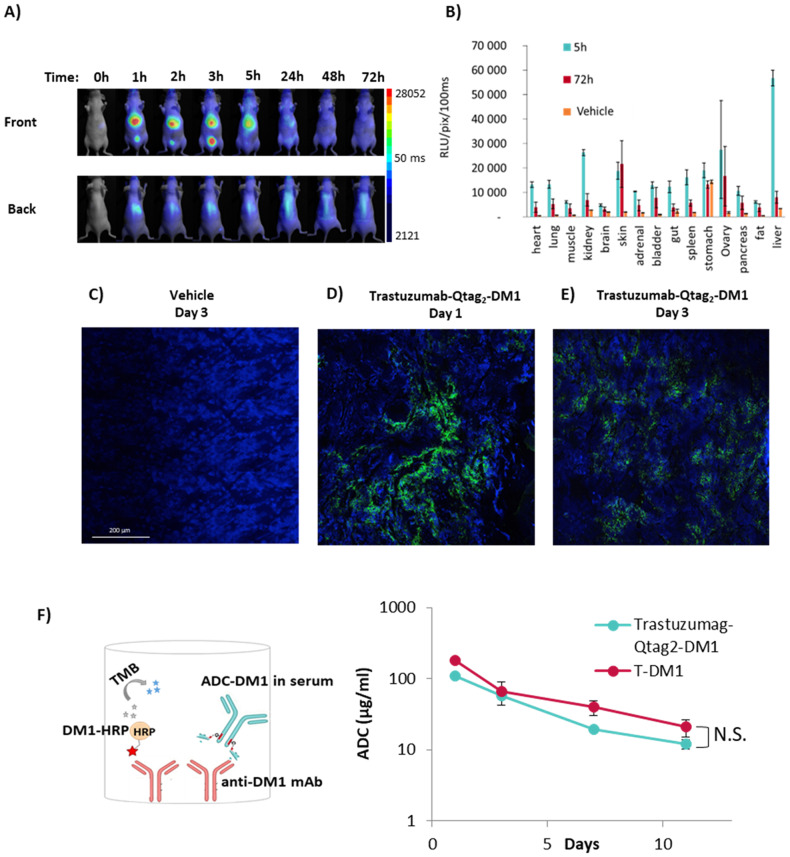
Fig. 5. Biodistribution of ADC.
A 2D in vivo fluorescent images of NMRI Nudes mice and B ex vivo fluorescent signal of organs after intravenous injection of AlexaFluor 680 labeled Trastuzumab-Qtag2-MMAE (Mean ± SEM (n = 4)). Immunofluorescent analysis of BT-474 tumor sections after intraperitoneal injection of C vehicle control or Trastuzumab-Qtag2-DM1 D on day 1 and E day 3. The green signal represents the homing of ADC using AlexaFluor488 labeled anti-DM1 mouse monoclonal antibody. Blue, DAPI (nucleus). F Quantitation of the ADCs concentrations in mouse serum (15 mg/kg of ADC, BT-474-Her2 positive tumor) was performed by competition ELISA assay. 96-well plates were coated with anti-DM1 mAb to capture ADC-DM1 and HRP-labeled DM1. The detected absorbance is inversely proportional to the amount of ADC-DM1 conjugate in the test sample (Mean ± SEM (n = 3). Statistical significance was evaluated using GraphPad Prism 7.0b (GraphPad Software Inc., San Diego, CA, USA) software using unpaired one tailed t-test, N.S. non significative.

