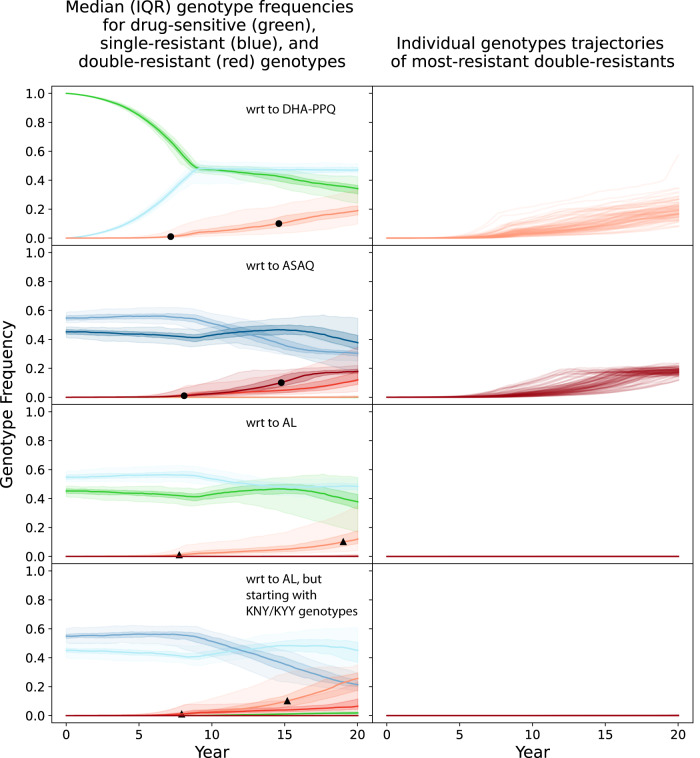
Fig. 1. Emergence and evolution of single-resistant and double-resistant P. falciparum genotypes under an adaptive cycling (status quo) drug distribution strategy, where DHA-PPQ is used first, ASAQ is used second, and AL is used last. Epidemiological scenario shown is 5% PfPR2-10 and 40% treatment coverage.
Single resistance (blue lines) and double resistance (red lines) are always defined with respect to (wrt) a particular artemisinin combination therapy due to the pleiotropic effects of loci in pfcrt and pfmdr1. Top row shows the evolution of single and double resistance to DHA-PPQ. Second row shows the evolution of single and double resistance to ASAQ. And third and fourth rows show the evolution of single and double resistance to AL. The first three rows show simulations that were started with “TNY” genotypes (76T, N86, Y184) which have some resistance to amodiaquine, while the fourth row shows simulations started with “KNY” genotypes which show more resistance to lumefantrine. For blue and red lines, the darker the shade the more resistance alleles are present for that resistant genotype. Green lines correspond to genotypes that have no resistance mutations with respect to each ACT. Shaded areas show interquartile ranges from 100 simulations, and light-shaded areas show 90% ranges from 100 simulations. Black circles show the 1% and 10% points for full double-resistants, indicating that full double resistance to DHA-PPQ and ASAQ reaches 0.10 genotype frequency after a median time of approximately 15 years. Black triangles show the 1% and 10% points for any double-mutant double-resistant genotypes to AL, i.e. genotypes with one artemisinin resistance mutation and exactly one lumefantrine resistance mutation. Right-hand panels show the 100 individual trajectories for the full double-resistants, showing that there is substantial variation in the time of emergence for these genotypes.

