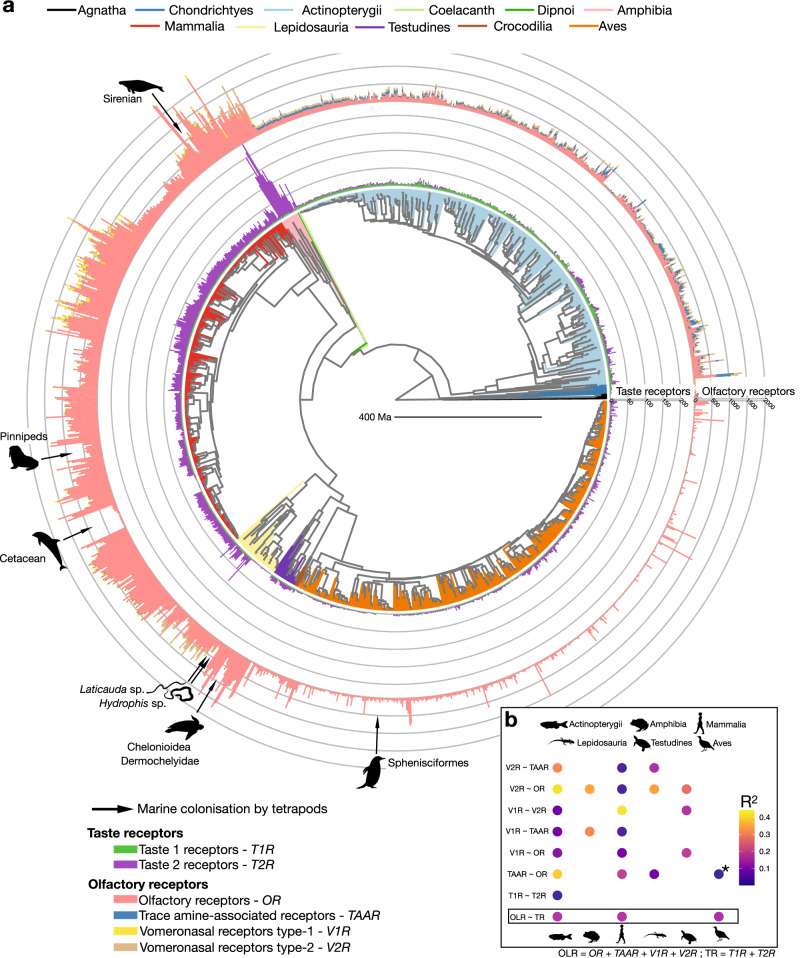
Fig. 1. Co-evolution of chemoreceptor gene repertoires in vertebrates.
a Phylogeny of 1532 vertebrate species, for which a genome assembly with more than 80% complete BUSCO genes was available (Sceloporus occidentalis is represented in the phylogeny but was excluded from the analysis; see Methods for details). The branches are colored according to the vertebrate (sub)class. The numbers of OR, TAAR, V1R, V2R, T1R and T2R genes for every species are shown as bars, color-coded as in the lower left panel. Independent marine colonization events by tetrapods (indicated by black arrows) are, for most parts, associated with decreases in chemoreceptor repertoire sizes. It is unknown whether the remaining genes in these species are functional in the context of chemoreception or used for other functions, as is the case for extranasal OR genes115,116. Phylogenies with full species names and sub-trees for each vertebrate (sub)class are available in Supplementary Figs. 10 and 11, respectively. Animal silhouettes were obtained from PhyloPic.org. b Correlations between the number of complete genes of the different chemoreceptor families, or between the number of complete olfactory (OLR) and the number of complete taste receptors (TR) (BUSCO80 dataset; see Supplementary Fig. 7 for the results with the BUSCO90 dataset and when considering only chromosome-scale assemblies). Correlations were assessed using a two-sided pGLS. All correlations were positive. Circles indicate PPGLS < 0.05 and are color-coded according to the pGLS R2-values, absence of a circle indicates PPGLS > 0.05. The association between OR and TAAR genes in birds (marked with an “*”) is the only one that became non-significant with the BUSCO90 dataset. Samples sizes for chemoreceptor families correlations can be retrieved from Supplementary Table 1. Source data are provided as a Source Data file.

