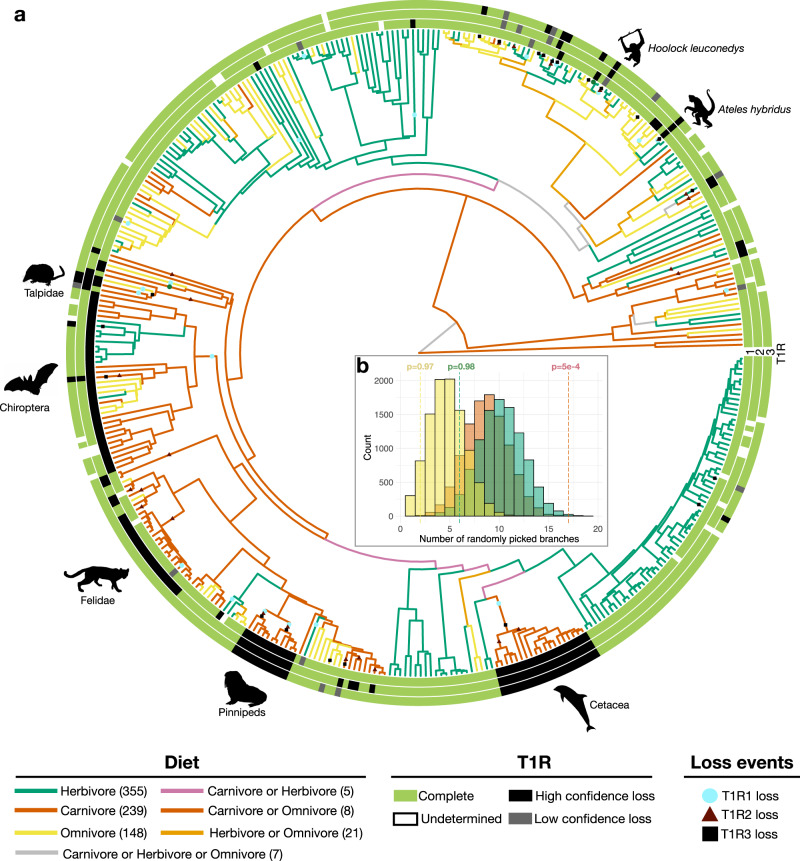
Fig. 3. Repeated loss of T1R2 in carnivore mammals.
a Phylogeny of mammals, for which a genome assembly with more than 80% complete BUSCO genes was available (392 species). Terminal branches are color-coded according to the diet preference taken from the MammalDiet database43. Diet preferences of internal branches were inferred with PastML. The status of each gene (T1R1, T1R2, T1R3) in each species is indicated (according to the four categories shown; see Methods for details). T1R loss events, inferred by shared loss-of-function mutations across species, are indicated on the respective branches. Large clades with T1R losses, or individual species that have lost all T1R genes, are highlighted with a silhouette. b Simulation result where T1R2 genes were randomly pseudogenized in the mammalian tree. The histogram represents the results of the simulations (with the x-axis representing the number of randomly drawn branches in the simulations) and the dashed lines represent the observed number of independent T1R2 loss per diet group (same color code as in the phylogeny). The P-value reported above each dashed line correspond to the number of simulations where the same or a greater number of independent T1R2 losses occurred than observed for the same branch category (carnivore, omnivore or herbivore), divided by the total number of simulations (10,000). All simulation results for T1R1, T1R2 and T1R3 are shown in Supplementary Fig. 38. Source data are provided as a Source Data file.

