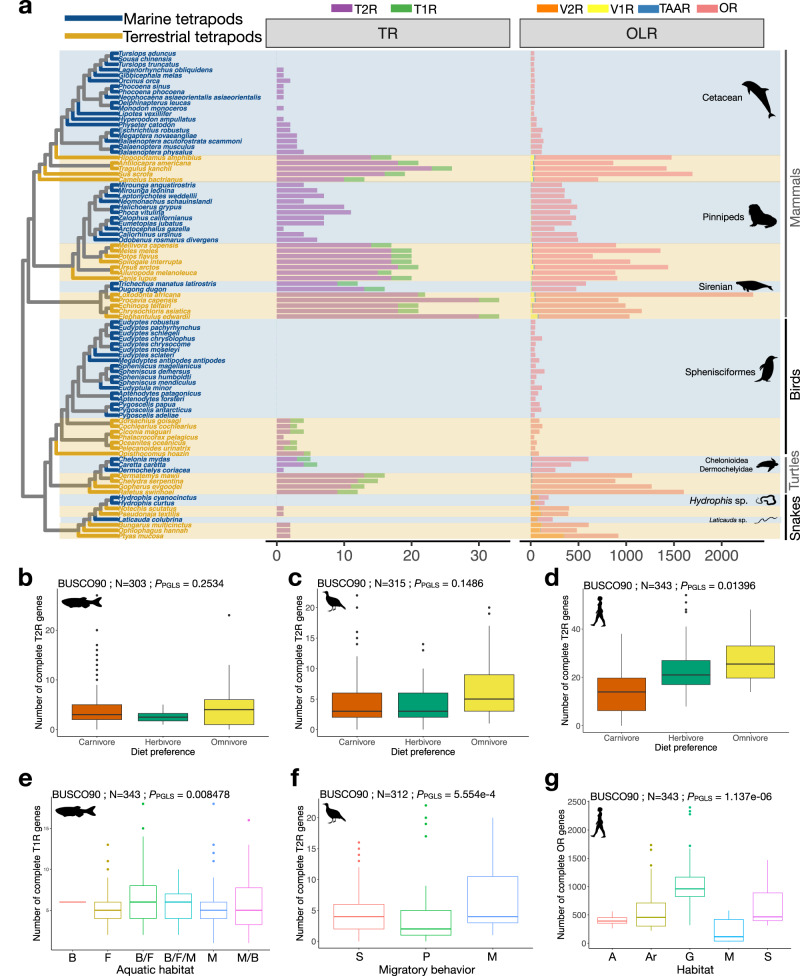
Fig. 4. Ecology of chemoreceptor evolution in vertebrates.
a Phylogeny of marine tetrapods and closely related species, displaying the number of olfactory and taste receptors. Genes are color-coded according to chemoreceptor family. The names of the marine species and the associated branches in the phylogeny are colored in blue, while the names of non-marine species and the respective branches are colored in brown. Marine clades feature a reduction in the number of olfactory and taste receptor genes. All marine clades, except sirenians, have lost their T1R genes; T2R genes are completely lacking from the genomes of Sphenisciformes and some cetaceans. Association between the number of T2R genes and diet preferences in ray-finned fishes assessed with a two-sided pGLS test (b), in birds and crocodiles (c), and in mammals (d). pGLS P-values are reported above each boxplot (for the BUSCO90 dataset; for BUSCO80 results and chromosome-scale assemblies see Supplementary Fig. 45), N refers to the number of genomes used for the respective analysis. For mammals, we further tested the impact of the two carnivore marine clades on the pGLS results (Supplementary Fig. 45). e–g Two-sided pGLS test results between ecological parameters and the number of chemoreceptor genes. Association between the number of complete T1R genes and the habitat in ray-finned fishes (e), the number of complete T2R genes and the migratory behavior in birds (f), and the number of complete OR genes and habitat in mammals (g). pGLS P-values are reported above each boxplot (for the BUSCO90 dataset, N refers to the number of genomes used for the respective analysis. Note that pGLS P-values are also significant with the BUSCO80 dataset or when considering only chromosome-scale assemblies (see Supplementary Fig. 46). Aquatic habitat in ray-finned fishes is coded as B…brackisch, F…freshwater, M…marine (allowing for combinations); migratory behavior in birds is coded as S…sedentary, P…partially migratory, M…migratory; habitat in mammals is encoded according to their ForStrat.Value as M…marine, G…ground level including aquatic foraging, S…scansorial, Ar…arboreal, A…aerial (see Supplementary Data 1). Boxplots represent the first quartile −1.5; the interquartile range, the first quartile, the mean, the third quartile and the third quartile +1.5 interquartile range. Dots represent outliers. Source data are provided as a Source Data file.

