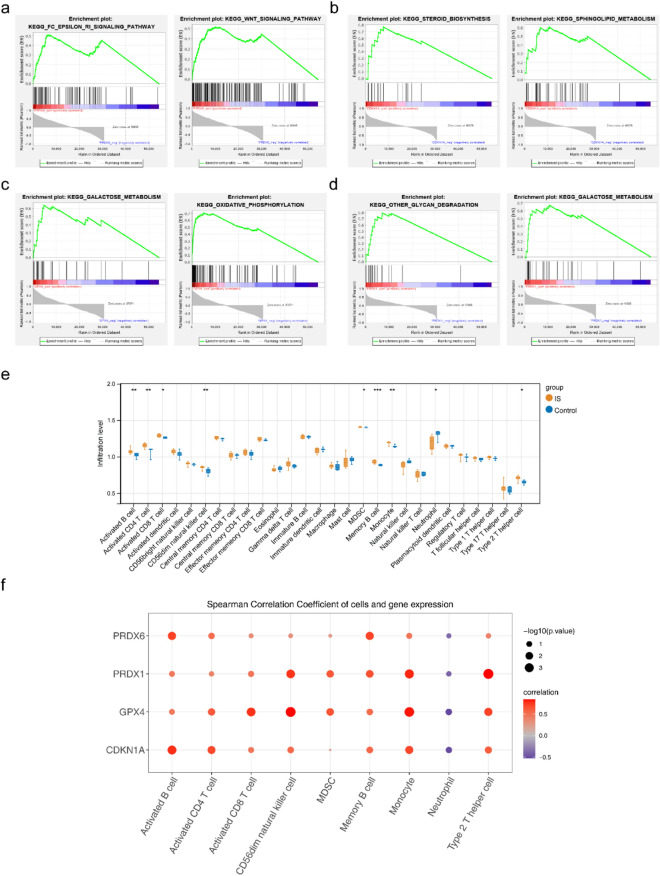
Figure 5.
GSEA enrichment analysis of PRDX6 and immunocyte infiltration analysis. (a) enplot_KEGG_FC_EPSILON_RI and WNT_signaling pathway. (b) enplot_KEGG_steroid biosynthesis and sphingolipid metabolism. (c) enplot_KEGG_galactose metabolism and oxidative phosphorylation. (d) enplot_KEGG_other glycan degradation and galactose metabolism. (e) Box plot of 28 immune cell expressions between groups. (f) Bubble chart of correlation between biomarkers and differential immune cells.

