Figure 3.

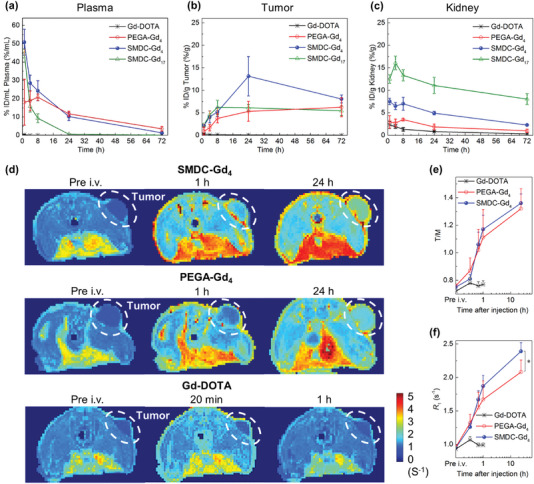
Tumor‐targeted accumulation and contrast enhancement for cancer diagnostics. a–c) Time profiles of Gd concentrations in plasma, tumors, and kidneys in mice after intravenous administration of Gd‐conjugated contrast agents at the dose of 5 mg kg−1 on Gd basis. Data are shown as mean ± s.d., n = 6. The blood circulation and clearance behaviors were presented by Gd concentrations in plasma. Meanwhile, time‐dependent tumor accumulation of SMDC‐Gds was observed, and SMDC‐Gd4 achieved the highest Gd concentration (13.1 ± 4.4% ID/g) in tumors at 24 h after administration. d) Quantitative longitudinal relaxation rate (R 1, 1/T 1, s−1) maps of CT26 tumor‐bear mice at 1‐tesla MRI, n = 4. Compared to the results of Gd‐DOTA and PEGA‐Gd4, the contrast in the tumor (white dashed area) was selectively enhanced by using SMDC‐Gd4 at both 1 and 24 h after intravenous administration. e,f) Comparison of tumor‐to‐muscle R 1 ratios (T/M) and R 1 values in tumor areas showed the enhancement of signals in tumor areas (white dashed area in (d) by SMDC‐Gd4. Data are shown as mean ± s.d., n = 4, ⁎ p < 0.05.
