
Figure 4.
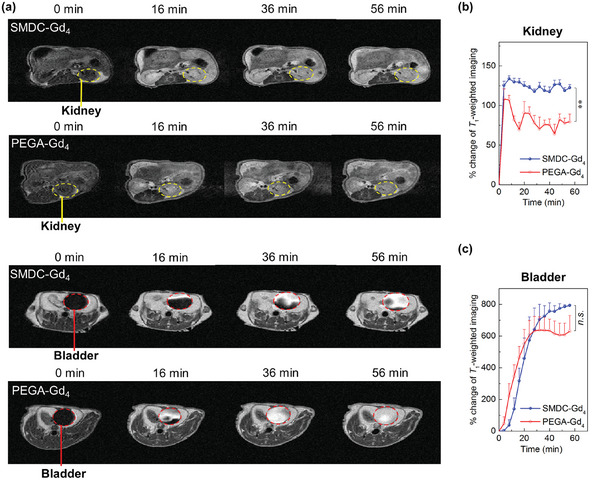
Renal excretion as measured by T1‐weighted MRI in tumor‐bearing mice. a) MRI of kidneys (yellow dashed areas) and bladders (red dashed areas) within 1 h after intravenous administration of SMDC‐Gd4 or PEGA‐Gd4. b,c) The comparison of longitudinal signal intensities in kidneys and bladders within 1 h after intravenous administration of SMDC‐Gd4 and PEGA‐Gd4. Data are shown as mean ± SEM, n = 3, ⁎⁎ p < 0.01, n.s. p ≥ 0.05.