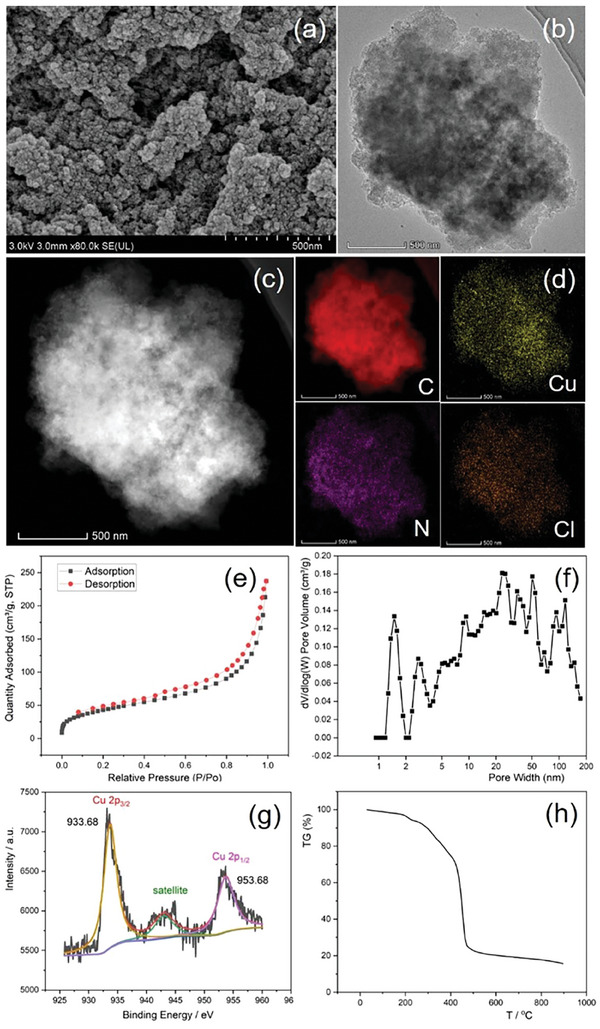
Figure 2.

Characterization results. a) Scanning electron microscopy image of CuCl@POL‐NHC‐Ph. b) TEM image of CuCl@POL‐NHC‐Ph. c) HAADF image of CuCl@POL‐NHC‐Ph. d) Energy‐dispersive X‐ray spectroscopy elemental mapping analysis of CuCl@POL‐NHC‐Ph. e) N2 adsorption–desorption isotherms, f) pore size distribution curves, g) Cu 2p XPS spectra of fresh CuCl@POL‐NHC‐Ph, and h) thermogravimetric analysis of CuCl@POL‐NHC‐Ph.
