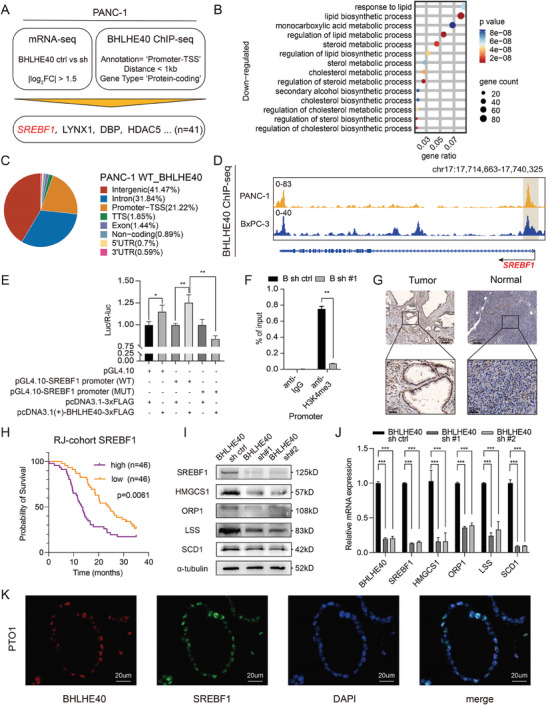
Figure 3.

Overexpression of BHLHE40 promotes tumorigenesis via altering the oncogenic transcriptome in PCa cells. A) Integrated analysis flowchart of RNA‐ and ChIP‐seq in PANC‐1 cells. Downregulated genes after BHLHE40 knockdown with log2 fold change >1.5 times were intersected with binding loci of BHLHE40. B) Bubble plot showing GO enrichment analysis of downregulated genes related to fatty acid metabolism after BHLHE40 knockdown. C) Pie chart of the distributions of BHLHE40‐binding regions. D) Close view of the SREBF1 gene loci and BHLHE40 ChIP‐seq signal in PANC‐1 and BxPC‐3 cells. E) Luciferase reporter assay results showed that BHLHE40 overexpression promoted the luciferase activity of the pGL4.10‐SREBF1 promoter (WT) rather than the mutant promoter. F) Enrichment levels of H3K4me3 at the promoter region of SREBF1 in BHLHE40 knockdown or control PANC‐1 cell were determined via ChIP‐qPCR assay. G) Representative images of SREBF1 IHC staining of PCa tumor and para‐tumor tissues. Scale bar, 200 µm (upper) or 50 µm (bottom). H) High SREBF1 protein levels also correlated with reduced overall survival (OS) outcomes based on the analysis of tissue microarray data from the RJ‐1 dataset. I,J) Expression levels of SREBF1 and subsequent fatty acid metabolism related proteins (HMGCS1, ORP1, LSS, and SCD1) were measured using western blot and qPCR assays in BHLHE40 knockdown or control PANC‐1 cells. K) Representative images of double immunofluorescence staining of SREBF1 (green) and BHLHE40 (red) in PTO1. DAPI (blue) was used for nuclei counterstaining. Data presentation: E,F,J) data were the mean ± s.d. of n = 3 independent experiments. Statistical analysis: one‐sided Fisher's exact test for (B); unpaired two‐sided t‐test for E,F,J); log‐rank test for (H); *P < 0.05, **P < 0.01, ***P < 0.001.
