Figure 4.

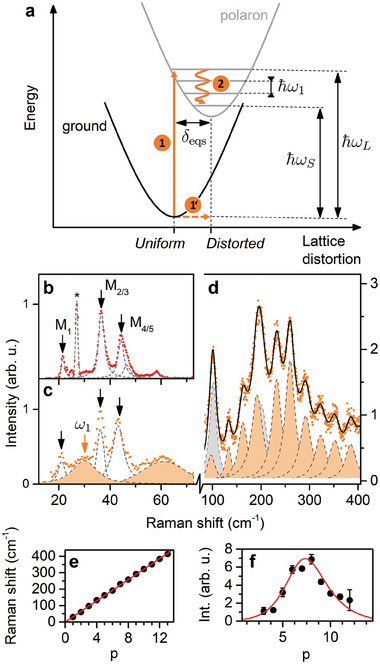
Determination of the Huang‐Rhys factor. a) Configuration coordinate diagram illustrating the potentials as a function of lattice distortion for ground and polaron states. The potentials are displaced by the lattice displacement parameter δ eqs. ℏω L , ℏω S , and ℏω1 are the excitation energy, energy of the scattered photon, and phonon energy, respectively. Orange arrows with 1 − 2 labels depict the Stokes resonant Raman scattering process. The low‐frequency portion of the scattering spectra for (b) non‐resonant (2.18 eV) and (c) resonant (2.6 eV) excitation conditions. Black arrows indicate the main optical modes of the inorganic sublattice. The orange shaded peaks spanning through panels (c, d) constitute the polaron vibronic progression, with the first element ω1 marked with an orange arrow. e) The energy of consecutive peaks in the progression. The solid red line is a linear fit. f) The intensity of consecutive signals building up the polaronic response. The line stands for fit with Equation (1). The gray shaded peaks in (d) correspond to the ≈ 100 cm−1 signal and its overtones.
