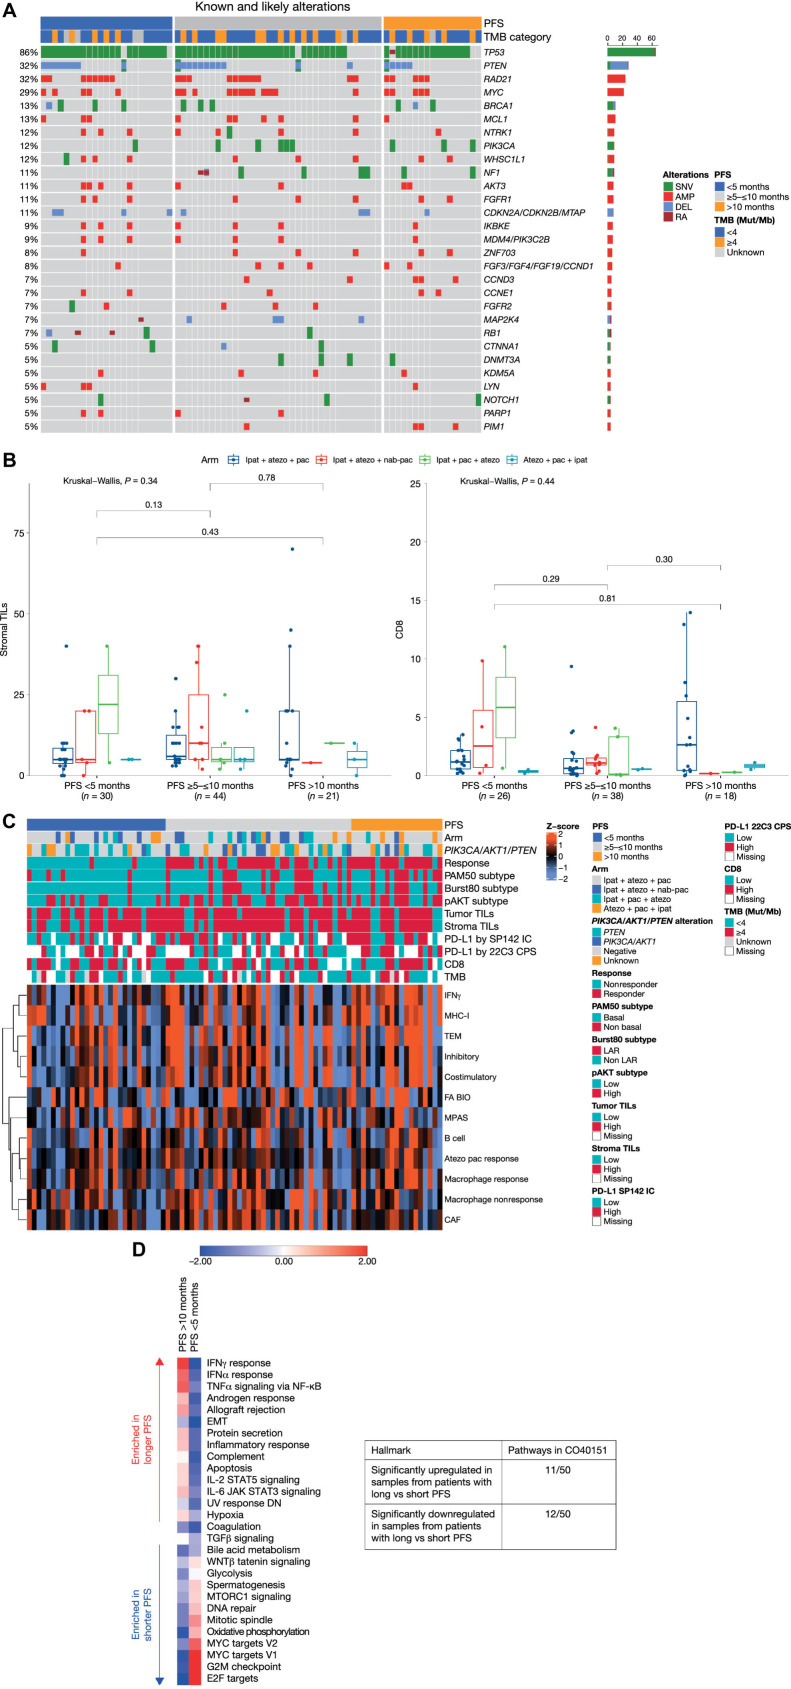
Figure 1.
Biomarker characterization. A, Genomic landscape. B, Stromal TILs and CD8 T cells according to PFS. The lower and upper bounds of the rectangles represent the first and third quartiles, the horizontal line represents the median, the whiskers extend to the highest and lowest values within 1.5× the interquartile range, and data beyond the end of the whiskers are outliers and are plotted as points. C, Baseline RNA-sequencing profile. Atezolizumab plus paclitaxel response represents a gene signature based on CD8-CXCL13 T cells that has previously been shown to predict better response to atezolizumab plus paclitaxel in TNBC (20). Similarly, the B-cell gene signature comprising CD19 and CXCR5 is predictive of better response to atezolizumab plus paclitaxel in TNBC. D, GSEA analysis on hallmark gene sets according to PFS. The scoring is averaged Z score of individual samples from gene set variation analysis in the subgroups with PFS <5 months and >10 months. AMP, amplification; atezo, atezolizumab; CAF, cancer-associated fibroblasts; CPS, combined positive score; DEL, deletion; EMT, epithelial–mesenchymal transition; FA BIO, fatty acid biosynthesis; IC, immune cell; ipat, ipatasertib; JAK, Janus kinase; LAR, luminal androgen receptor; MPAS, MAPK pathway activity score (30); MHC-I, major histocompatibility complex-I; Mut/Mb, mutations/megabase; NF-κB, nuclear factor kappa-B; pac, paclitaxel; RA, rearrangement; SNV, single-nucleotide variation; TEM, T effector memory.

