. 2023 Oct 6;30(4):824–835. doi: 10.1158/1078-0432.CCR-23-1689

Figure 2.

Figure 2. Kaplan–Meier analysis of OS for the PD-L1 TC or IC ≥1% subgroup (A) and the PD-L1 TC and IC <1% subgroup (B). CI, confidence interval; D, durvalumab; EP, platinum-etoposide; HR, hazard ratio; IC, immune cell; OS, overall survival; PD-L1, programmed cell death ligand-1; T, tremelimumab; TC, tumor cell.

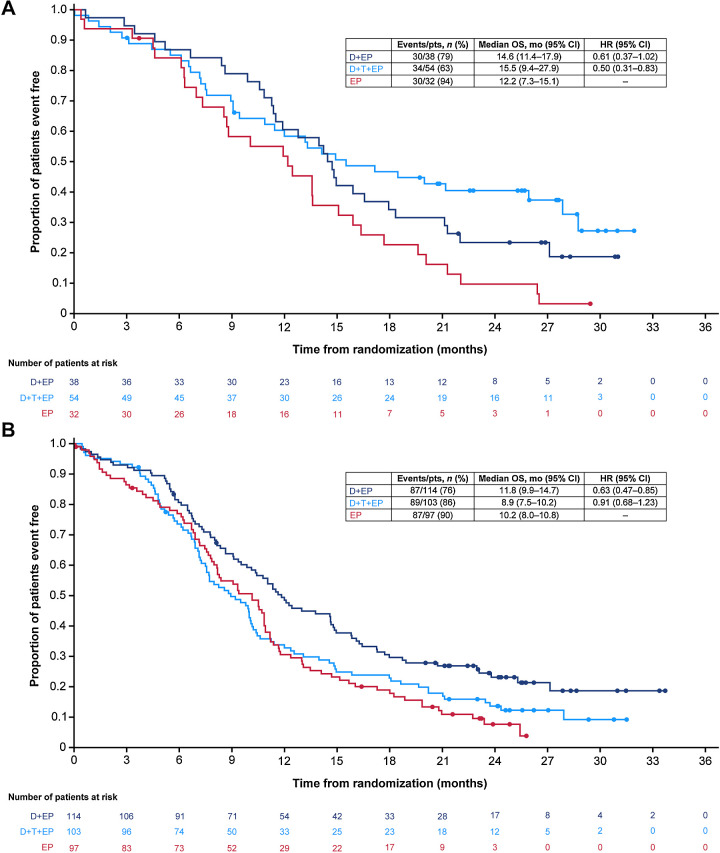
Kaplan–Meier analysis of OS for the PD-L1 TC or IC ≥1% subgroup (A) and the PD-L1 TC and IC <1% subgroup (B). CI, confidence interval; D, durvalumab; EP, platinum-etoposide; HR, hazard ratio; IC, immune cell; OS, overall survival; PD-L1, programmed cell death ligand-1; T, tremelimumab; TC, tumor cell.