. 2023 Oct 6;30(4):824–835. doi: 10.1158/1078-0432.CCR-23-1689

Figure 4.

Figure 4. Subgroup analysis of OS by tTMB for durvalumab plus tremelimumab plus EP versus EP (A) and durvalumab plus EP versus EP (B). In each panel, the shaded band shows the CI for the ITT population; circle sizes are proportional to the number of events. BEP, biomarker evaluable population; CI, confidence interval; D, durvalumab; EP, platinum-etoposide; HR, hazard ratio; ITT, intention-to-treat; OS, overall survival; mut/Mb, mutations per megabase; T, tremelimumab; tTMB, tissue tumor mutational burden.

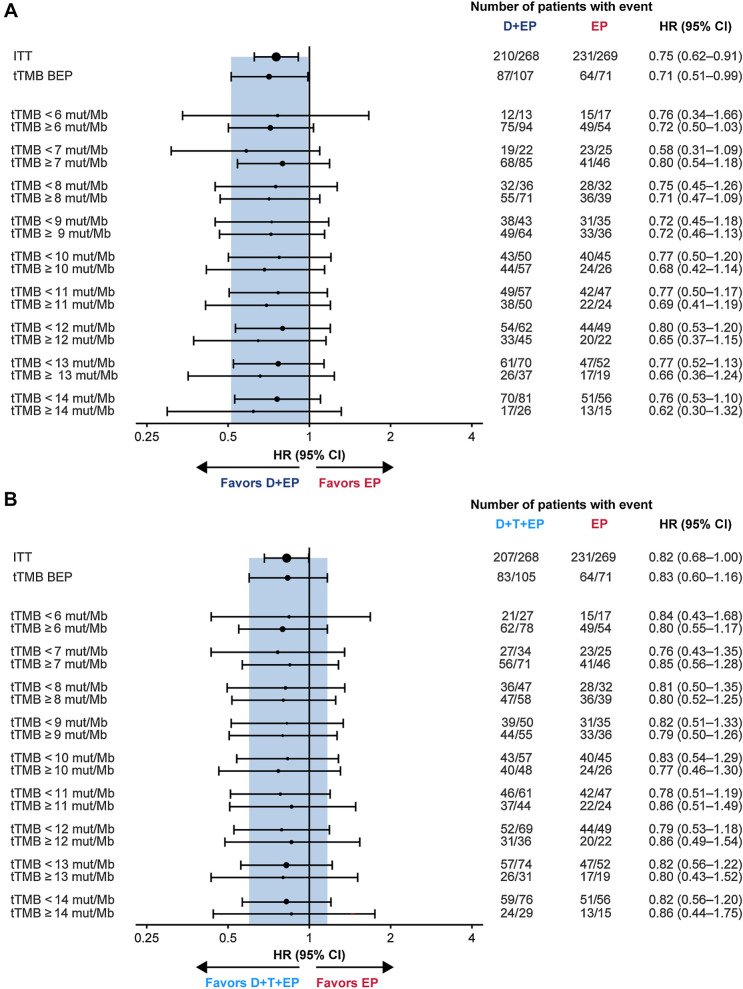
Subgroup analysis of OS by tTMB for durvalumab plus EP versus EP (A) and durvalumab plus tremelimumab plus EP versus EP (B). In each panel, the shaded band shows the CI for the ITT population; circle sizes are proportional to the number of events. BEP, biomarker evaluable population; CI, confidence interval; D, durvalumab; EP, platinum-etoposide; HR, hazard ratio; ITT, intention-to-treat; OS, overall survival; mut/Mb, mutations per megabase; T, tremelimumab; tTMB, tissue tumor mutational burden.