. 2023 Dec 7;30(4):836–848. doi: 10.1158/1078-0432.CCR-23-2693

Figure 4.

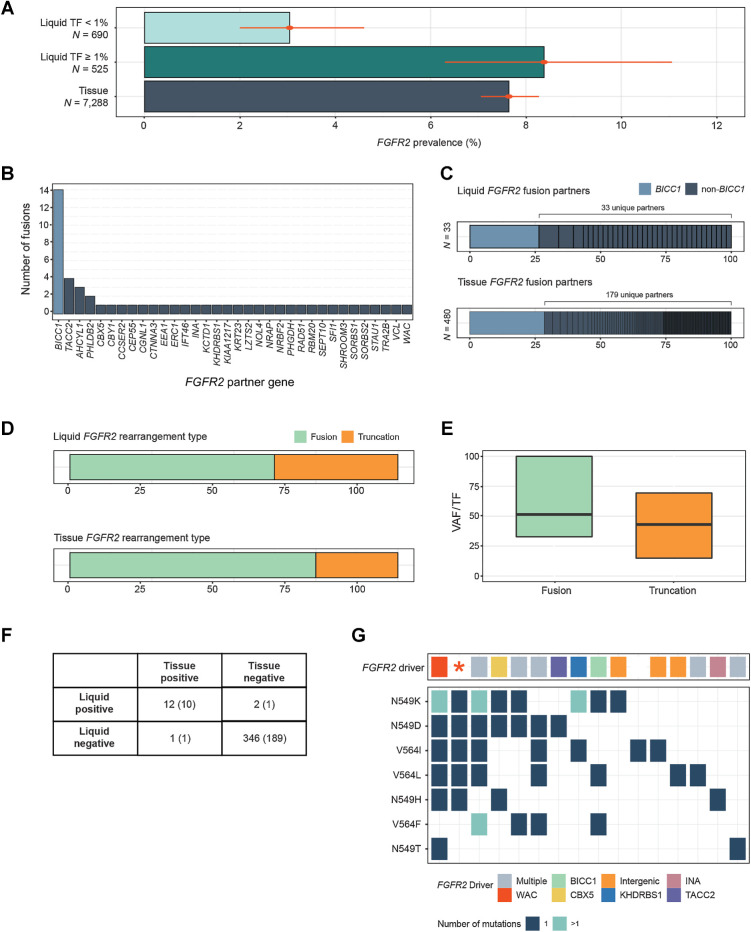
Figure 4. Detection of FGFR2 rearrangements in cholangiocarcinoma. A, Comparison of the prevalence of FGFR2 activating rearrangements among CCA tissue biopsies and liquid biopsies with TF ≥1% and <1%. B, Gene partners in rearrangements predicted to encode FGFR2 fusion genes. C, A comparison between the diversity of FGFR2 fusion gene partners in CCA tissue and liquid biopsies. D, A comparison of the prevalence of FGFR2 fusions versus truncations in CCA tissue and liquid biopsies. E, The clonality (VAF/TF) of FGFR2 fusions and rearrangements in CCA liquid biopsies. F, Concordance of FGFR2 rearrangement detection in a set of samples from the same patient (201 CCA, 160 CUP pairs). Numbers in parentheses are the concordance results within CCA pairs alone. G, Results from 16 LBx where FGFR inhibitor resistance mutations were detected (one sample per vertical column). The top row shows the presumed FGFR2 driver, while the grid below shows the presence of particular FGFR inhibitor acquired resistance mutations. Colors indicate the gene fusion partners detected, “intergenic” indicates a truncation without a specific fusion partner, and the red asterisk denotes a sample with a FGFR2 C382R driver mutation. In 15 of 16 samples, a FGFR2 driver variant was detected alongside resistance mutations.

Detection of FGFR2 rearrangements in cholangiocarcinoma. A, Comparison of the prevalence of FGFR2 activating rearrangements among CCA tissue biopsies and liquid biopsies with TF ≥1% and <1%. B, Gene partners in rearrangements predicted to encode FGFR2 fusion genes. C, A comparison between the diversity of FGFR2 fusion gene partners in CCA tissue and liquid biopsies. D, A comparison of the prevalence of FGFR2 fusions versus truncations in CCA tissue and liquid biopsies. E, The clonality (VAF/TF) of FGFR2 fusions and rearrangements in CCA liquid biopsies. F, Concordance of FGFR2 rearrangement detection in a set of samples from the same patient (201 CCA, 160 CUP pairs). Numbers in parentheses are the concordance results within CCA pairs alone. G, Results from 16 LBx where FGFR inhibitor resistance mutations were detected (one sample per vertical column). The top row shows the presumed FGFR2 driver, while the grid below shows the presence of particular FGFR inhibitor acquired resistance mutations. Colors indicate the gene fusion partners detected, “intergenic” indicates a truncation without a specific fusion partner, and the red asterisk denotes a sample with a FGFR2 C382R driver mutation. In 15 of 16 samples, a FGFR2 driver variant was detected alongside resistance mutations.