. 2023 Dec 7;30(4):836–848. doi: 10.1158/1078-0432.CCR-23-2693

Figure 5.

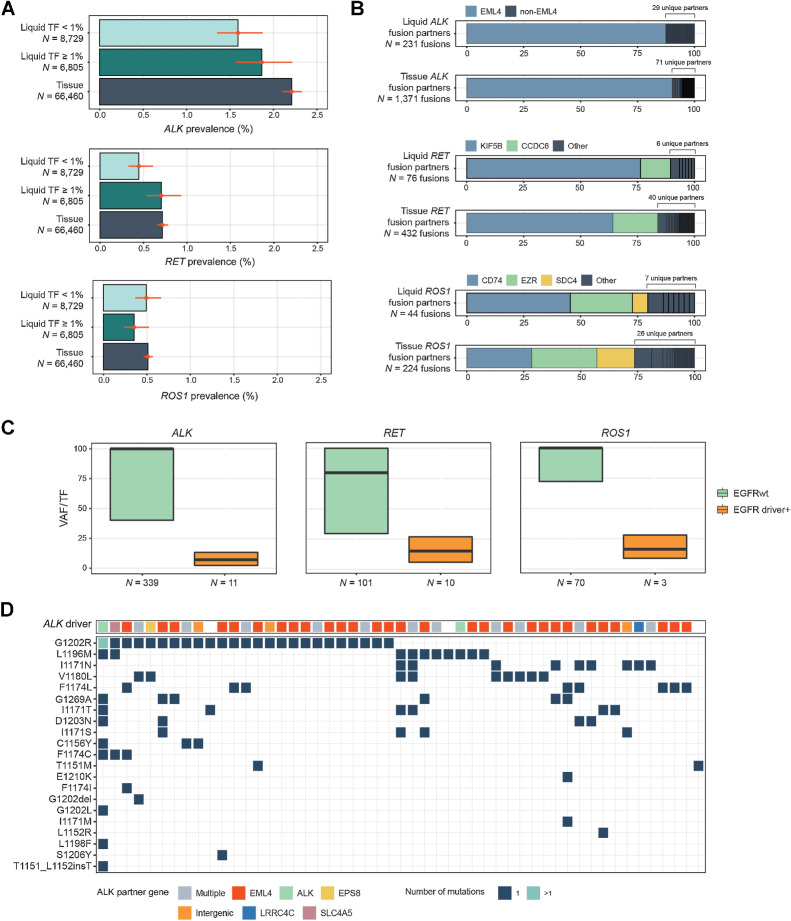
Figure 5. Detection of kinase rearrangements in NSCLC. A, Comparison of the prevalence of activating rearrangements in ALK, RET, and ROS1 among NSCLC tissue biopsies and liquid biopsies with TF ≥1% and <1%. B, A comparison of the diversity of fusion gene partners in ALK, RET, and ROS1 fusions in tissue and liquid biopsies. C, Comparison of the clonality of ALK, RET, and ROS1 rearrangements in samples with and without EGFR driver short variants (L858R, exon 19 deletion, or exon 20 insertion). D, Results from 51 LBx where ALK inhibitor resistance mutations were detected (one sample per vertical column). The top row shows the ALK fusion driver, while the grid below shows the presence of particular ALK inhibitor acquired resistance mutations. Colors indicate the gene fusion partners detected. In 47/51 samples; an ALK fusion was detected alongside resistance mutations.

Detection of kinase rearrangements in NSCLC. A, Comparison of the prevalence of activating rearrangements in ALK, RET, and ROS1 among NSCLC tissue biopsies and liquid biopsies with TF ≥1% and <1%. B, A comparison of the diversity of fusion gene partners in ALK, RET, and ROS1 fusions in tissue and liquid biopsies. C, Comparison of the clonality of ALK, RET, and ROS1 rearrangements in samples with and without EGFR driver short variants (L858R, exon 19 deletion, or exon 20 insertion). D, Results from 51 LBx where ALK inhibitor resistance mutations were detected (one sample per vertical column). The top row shows the ALK fusion driver, while the grid below shows the presence of particular ALK inhibitor acquired resistance mutations. Colors indicate the gene fusion partners detected. In 47/51 samples; an ALK fusion was detected alongside resistance mutations.