. 2023 Oct 24;30(4):663–672. doi: 10.1158/1078-0432.CCR-23-1892

Figure 2.

Figure 2. Illustration of a standard disease course for (A) localized to metastatic disease and (B) for primary metastatic disease, highlighting the potential of biomarkers at the various steps. Detection limits for both radiologic assessments and potential biomarkers are indicated. Lead time indicates the time from detection of residual disease/relapse/disease progression by use of a biomarker to the time for which the residual disease/relapse/disease progression can be detected by current standard CT scans. The radiation symbol denotes imaging. (Adapted from an image created with BioRender.com.)

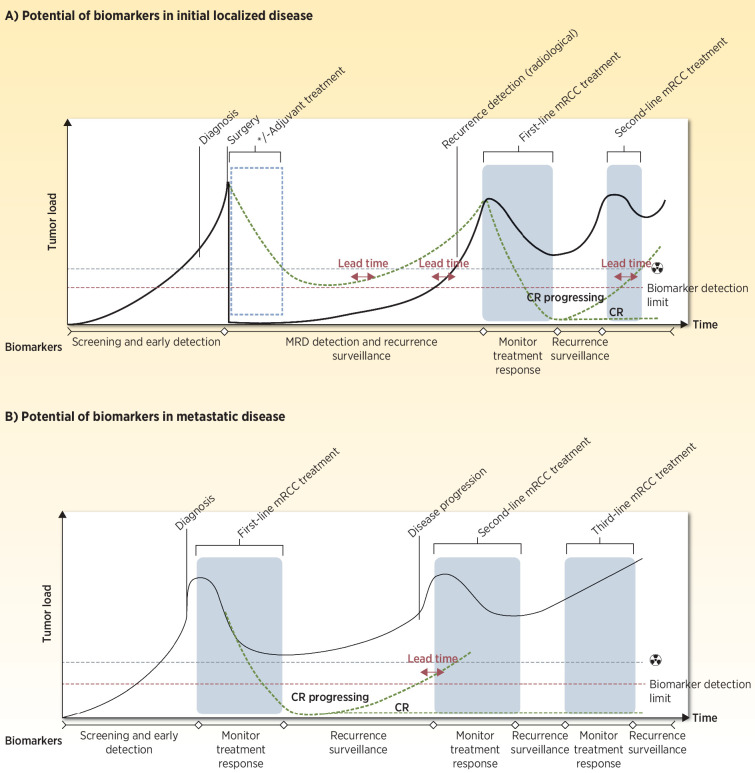
Illustration of a standard disease course for (A) localized to metastatic disease and (B) for primary metastatic disease, highlighting the potential of biomarkers at the various steps. Detection limits for both radiologic assessments and potential biomarkers are indicated. Lead time indicates the time from detection of residual disease/relapse/disease progression by use of a biomarker to the time for which the residual disease/relapse/disease progression can be detected by current standard CT scans. The radiation symbol denotes imaging. (Adapted from an image created with BioRender.com.)