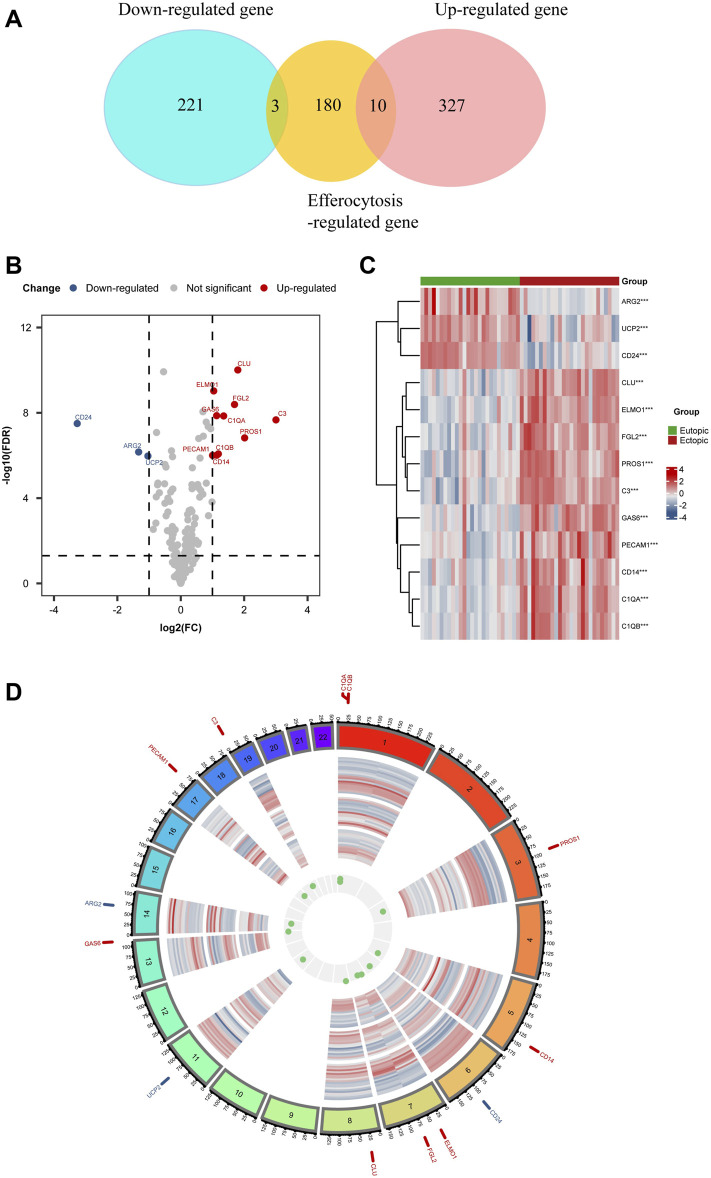
FIGURE 3.
EFRDEGs in endometriosis: (A) Venn diagram illustrating the overlapping genes among DEGs, Efferocytosis-related genes, and EFRDEGs in EMs. In the representation, red demonstrates differentially upregulated genes, blue signifies differentially downregulated genes, and yellow represents efferocytosis-related genes. (B) Volcano plot displaying the 13 identified EFRDEGs in EMs. Red displays upregulated genes while blue displays downregulated genes. (C) Heatmap visualizing the expression levels of the 13 EFRDEGs. Red shows high expression, and blue shows low expression. (D) Chromosome region of the 13 ERDEGs. Gene names shown in red represent upregulated genes in the disease group while blue represents downregulated genes.

