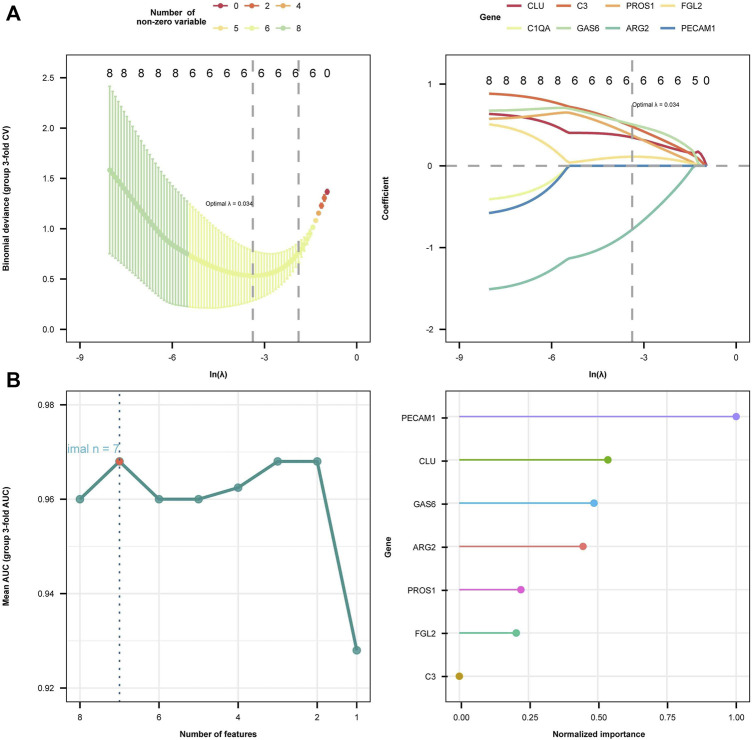
FIGURE 6.
Diagnostic biomarkers selection using two machine learning methods. (A) The least absolute shrinkage and selection operator (LASSO) algorithm results are presented in two plots. In the left plot, the horizontal axis symbolizes log(λ) values and the vertical axis symbolizes regression cross-validation errors. The right plot displays the ln-transformed minimum log(λ) values along the horizontal axis and the corresponding coefficients on the vertical axis. Six genes whose coefficients were not 0 when lambda = 0.037 were screened out. (B) Support vector machine recursive feature elimination (SVM-RFE) regression model algorithm identified seven diagnostic biomarkers. The right plot illustrates the ranking of these seven feature genes according to their importance from highest to lowest as follows: PECAM1, GLU, GAS6, ARG2, PROS1, FGL2, and C3.

