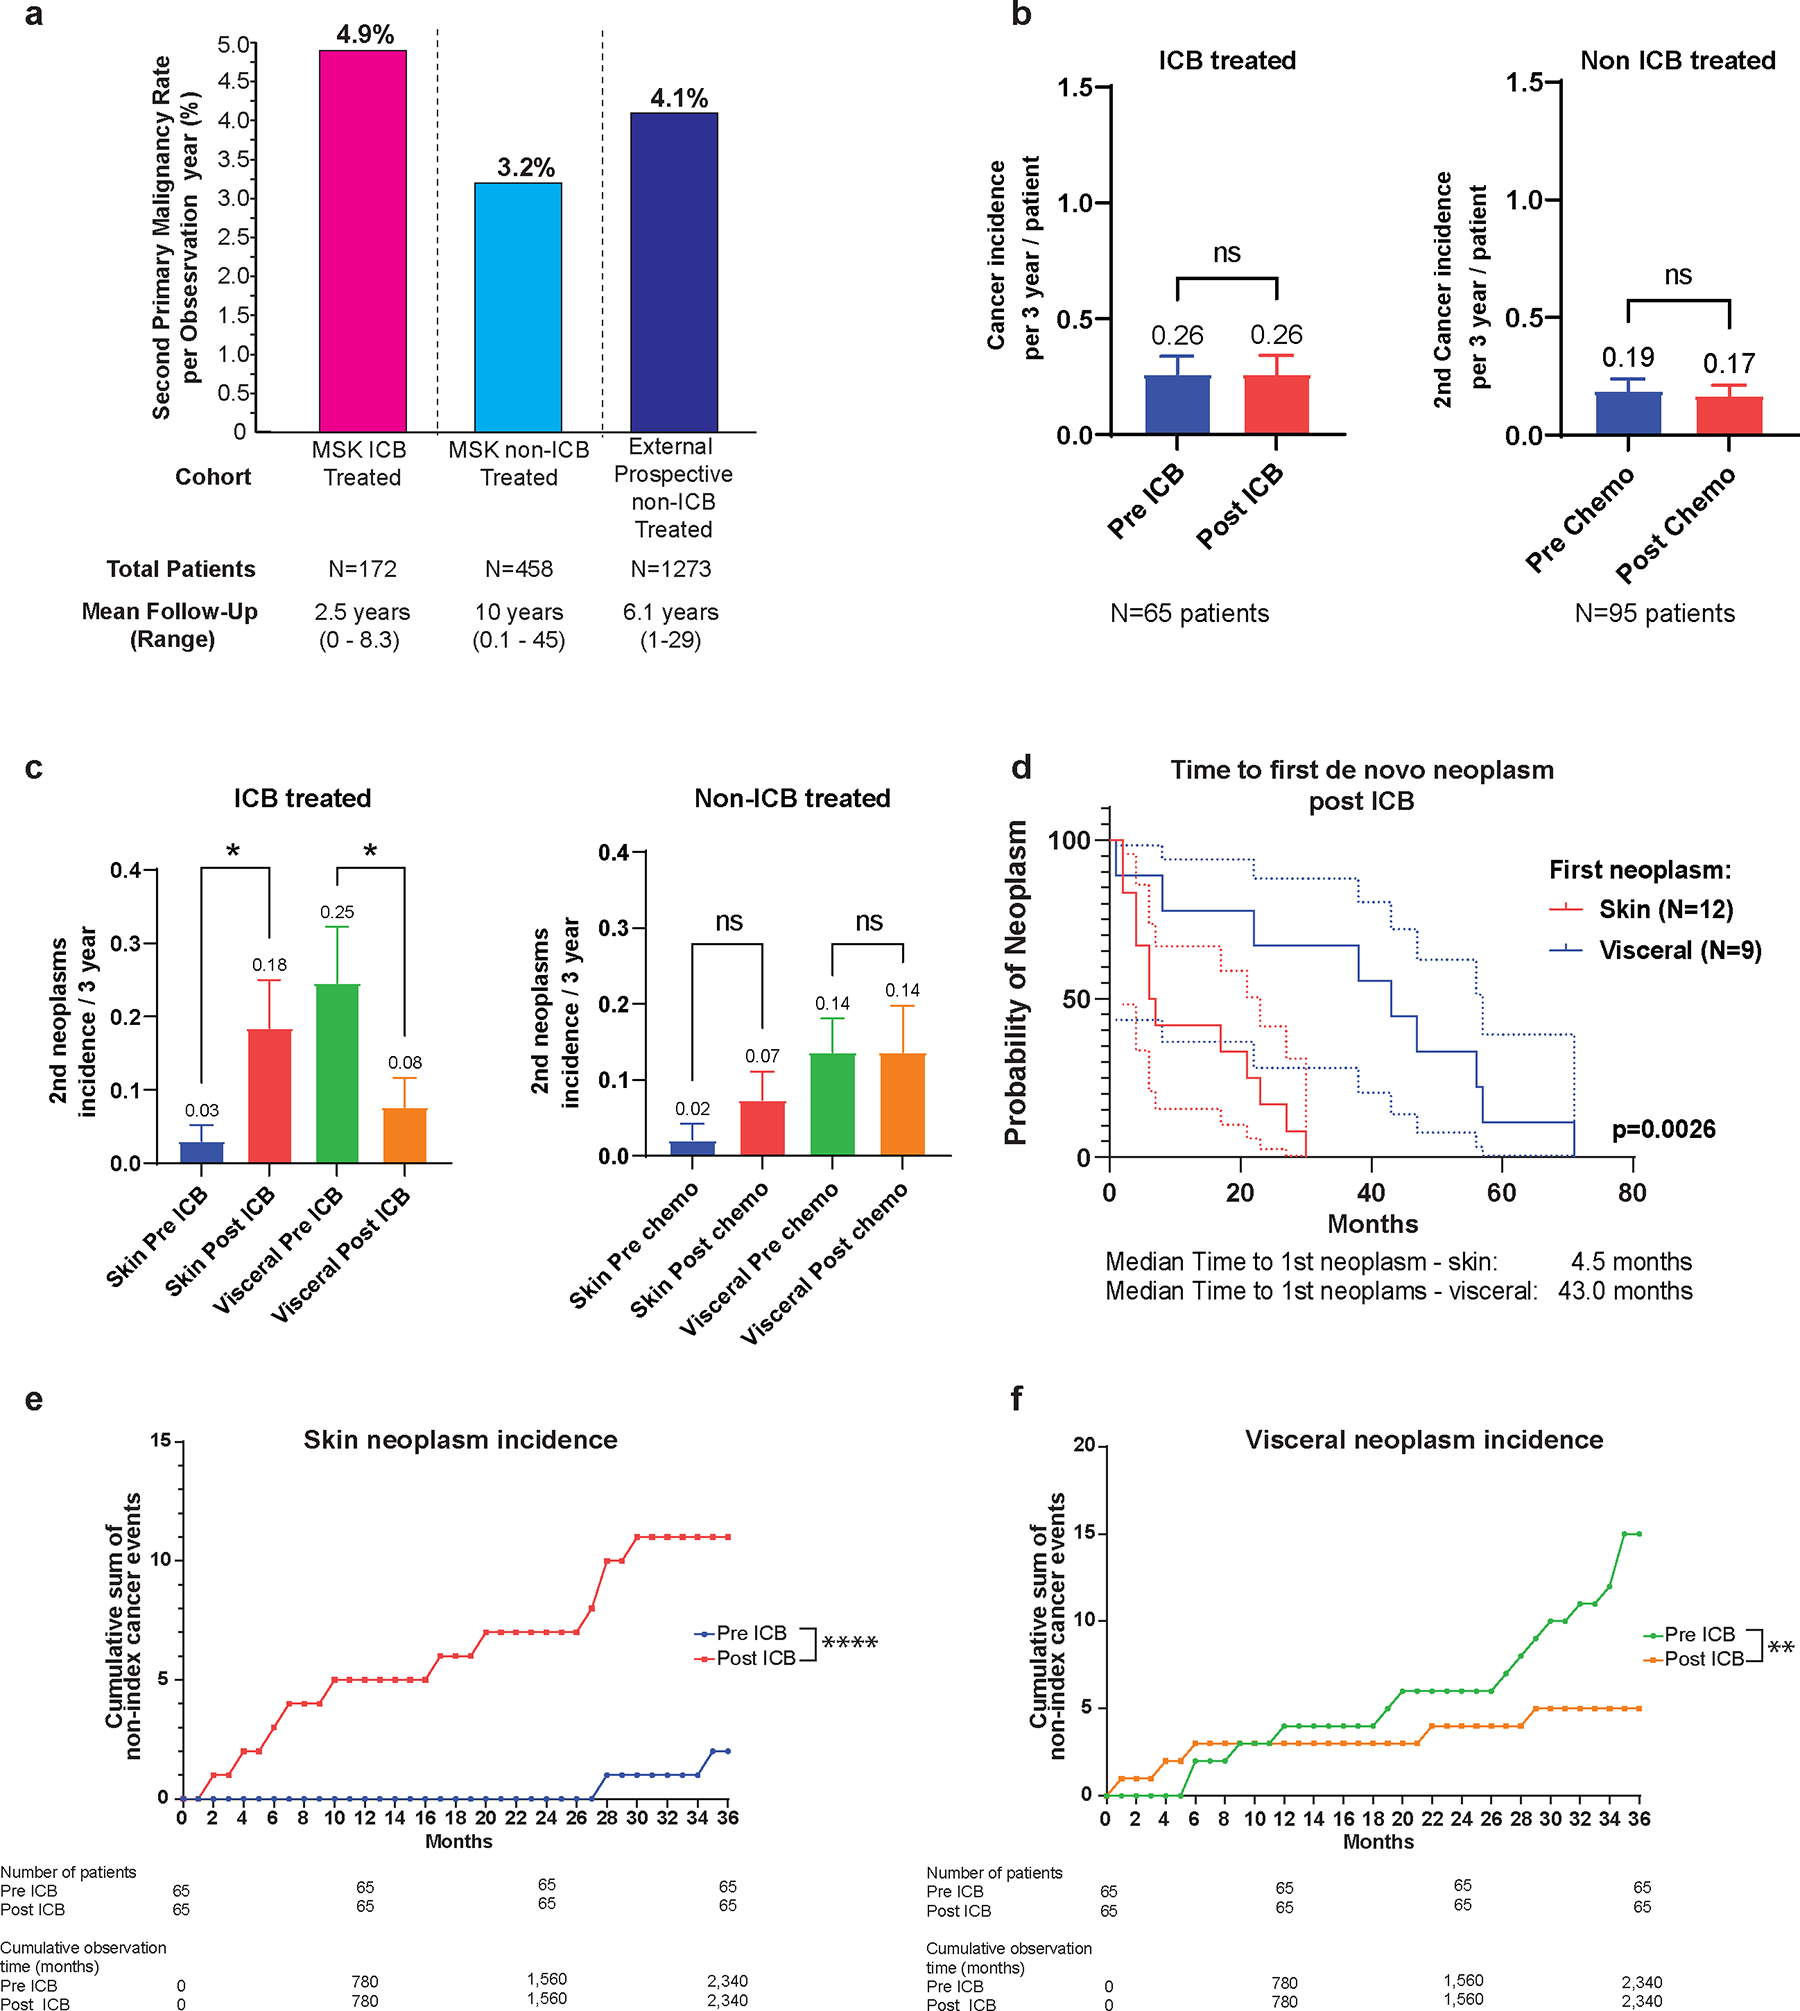
Figure 2. Incidence of subsequent primary malignancies (SPM) and site of origin in the study cohort and comparator Lynch syndrome (LS) cohorts.

a, Rate of SPM per observation year in the ICB treated cohort (pink) and comparator cohorts inclusive of internal non-immune checkpoint blockade (non-ICB) exposed LS patients (light blue) and external multi-center LS patients undergoing prospective surveillance after the first cancer diagnosis (dark blue)11.
b, Overall SPM incidence at 3-years matched follow-up in the ICB treated (pre- and post-ICB) and non-ICB treated cohort (pre- and post-chemotherapy). The number of matched patient pre/post ICB or pre/post chemotherapy is reported below the figure. The 3 year incidence of 2nd neoplasm for each clinical condition is reported above the box plot representing the mean and standard deviation (SEM). Pre and post 3 year incidence were compared using paired t test. ns: non significant, P>0.05.
c, Incidence of cutaneous and visceral neoplasms at 3-years matched follow-up in patients pre- and post-ICB, and pre- and post-chemotherapy. The numbers of matched patient pre/post ICB or pre/post chemotherapy are respectively 65 and 95 patients. The 3 year incidence of 2nd neoplasm category (skin or visceral) for each clinical condition is reported above the box plot representing the mean and standard deviation (SEM). Pre and post 3 year incidence were compared using repeated measure one way ANOVA test corrected for multiple comparisons comparing 3 year incidences of de novo cutaneous or visceral neoplasms. *: P≤0.05 and P>0.01, ns: non significant, P>0.05.
d, Time to first cutaneous or visceral neoplasm post-ICB exposure. The number of patients is reported on the figure, each patient being accounted only once based on first 2nd neoplasm type (skin or visceral). The median time to first 2nd neoplasm post ICB is reported. Survival curves were compared using log rank test and the p-value is reported on the figure. The dashed lines represent the upper and lower limit of the confidence interval at 95% for each conditions with matched colors.
e, f, Cumulative incidence of cutaneous (e) versus visceral (f) post-ICB SPM. Patients with a matched follow up pre- and post-ICB of 36 months were selected and all non-index cancers occurring during the window of observation were accounted for. Cumulative incidence is reported as the cumulative sum of non-index cancers occurring during the period of observation. Number of patients and cumulative observation time in months is reported. Fisher’s exact test comparing the cumulative observation time without a neoplasm event to the number of months with an event was used for statistical analysis. ****: P<0.0001 ; **: P≤0.01 and >0.001.
