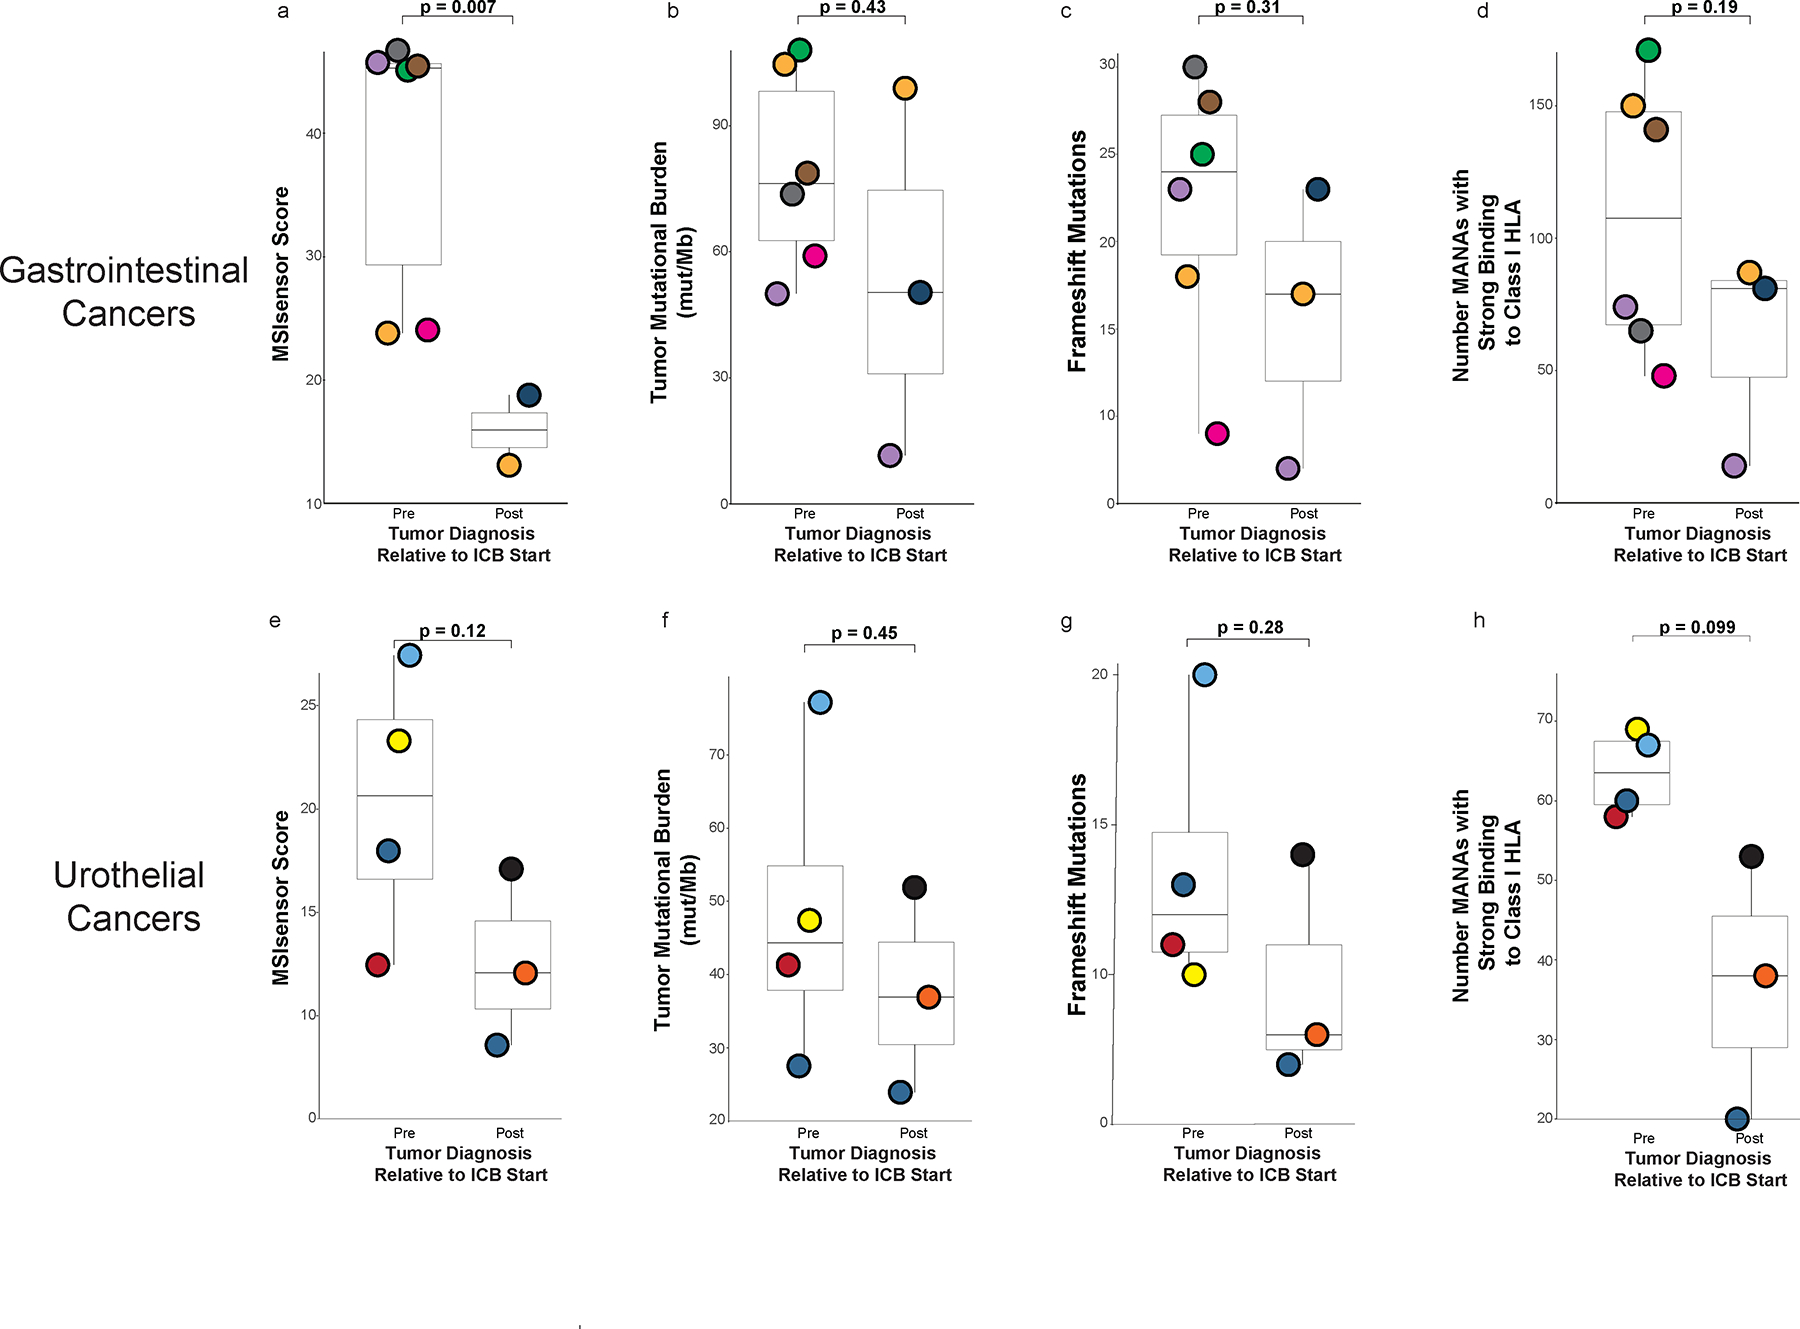
Extended Data Fig. 4. Sensitivity analyses of pre- and post-immune checkpoint blockade (ICB) exposed tumors using MSK-IMPACT next generation sequencing derived data22.

a, d, MSIsensor score, tumor mutational burden (TMB), frameshift mutation rates and number of mutation associated neoantigens (MANA) between pre- and post-ICB exposed tumors when grouped by gastrointestinal cancer only. e-h, MSIsensor score, tumor mutational burden (TMB), frameshift mutation rates and number of mutation associated neoantigens (MANA) between pre- and post-ICB exposed tumors when grouped by urothelial cancers only. All boxplots are composed of median (central line), 25th–75th percentile (box edges), and minimum and maximum values (whiskers). P-values are derived from student’s t-test (unpaired) between pre and post tumors agnostic of patient identity. Analysis a (MSIsensor score) includes 8 unique tumors (6 pre and 2 post) from 7 unique patients, and the other analyses, b-h, include 9 unique tumors (6 pre and 3 post) from 7 unique patients.
