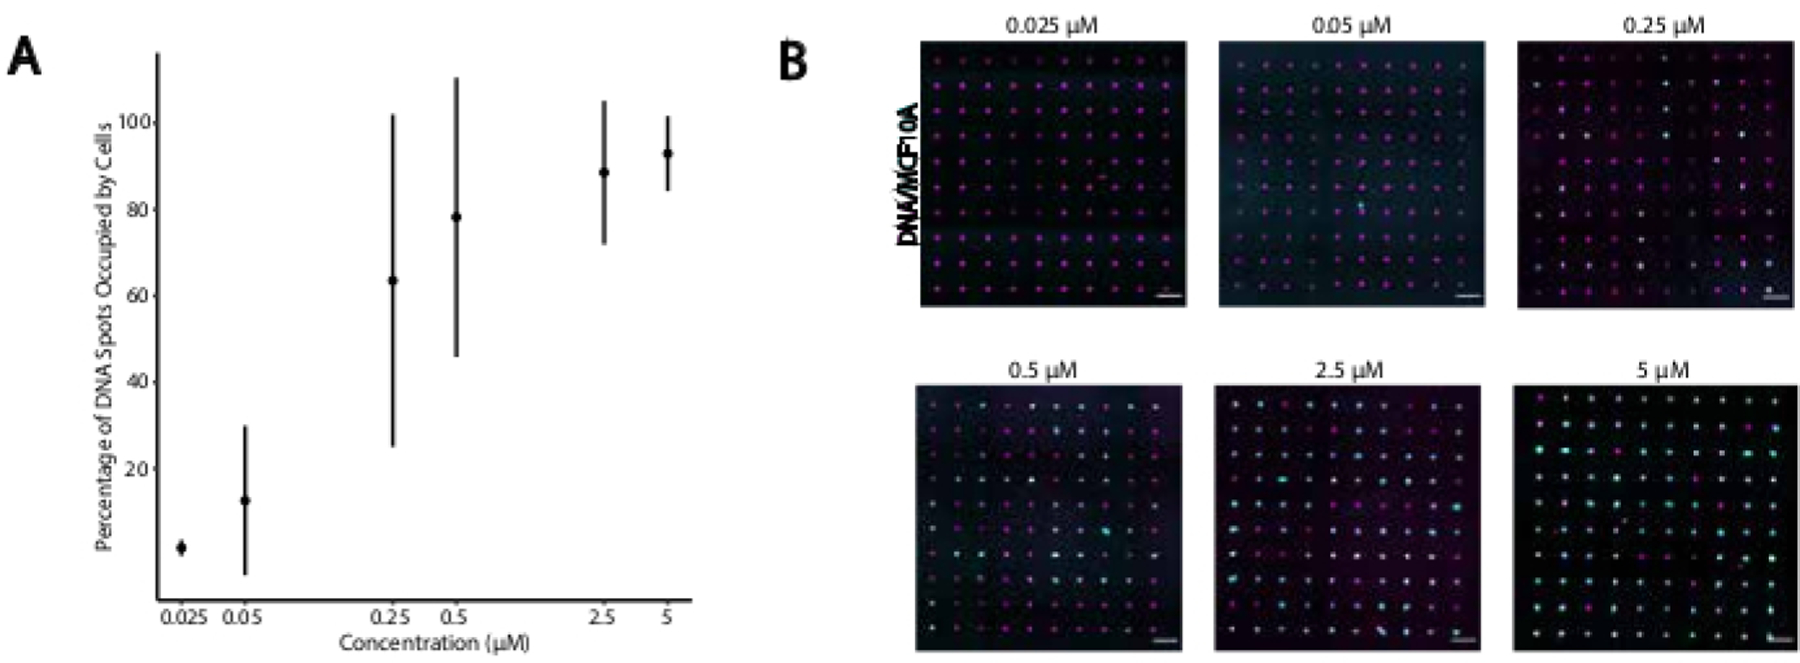
Figure 4: Adhesion of CMO-labeled cells to DNA patterns increases as a function of CMO concentration during labeling.

In this experiment, the Universal Anchor + Adapter Strand (pre-hybridized) and the Universal Co-Anchor were used at equal concentrations. Concentration refers to the concentration of CMO in the cell suspension during CMO labeling of cells. (A) Quantification of the percentage of 15 µm diameter DNA spots that were occupied by CMO-labeled MCF10A cells as a function of CMO concentration during cell labeling. Data represented as the mean ± standard deviation from three experiments. (B) Representative images of the DNA patterns (magenta) and adhered MCF10As (cyan) at different concentrations of CMO. Scale bar = 100 µm.
