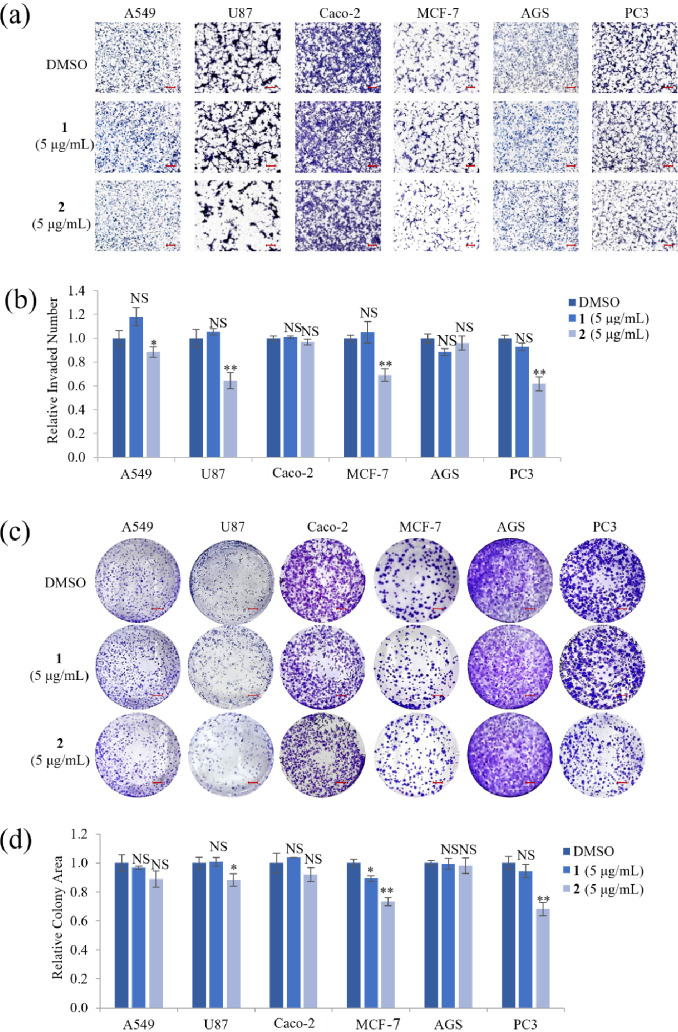
Figure 4.
Effect of compounds 1 and 2 on cell invasion and proliferation of various cancer cell lines. (a) Representative images of A549, U87, Caco-2, MCF-7, AGS, and PC3 cells that invaded through a transwell coated with 1% gelatin after treatment with a nontoxic concentration (5 μg/mL) of compounds 1 or 2 for 24 h. Scale bar = 100 μm. (b) Quantitative analysis of the number of invaded cells in each group. (c) Representative images and (d) quantitative analysis of a clonogenic assay in various cancer cell lines treated with 5 μg/mL of compounds 1 or 2 for 14 days. Representative images from three independent experiments are shown (n = 3). Scale bar = 35 mm. Data represent the mean ± standard deviation. *p < 0.05; **p < 0.01; NS, no significant difference compared with DMSO-treated cells in each group.

