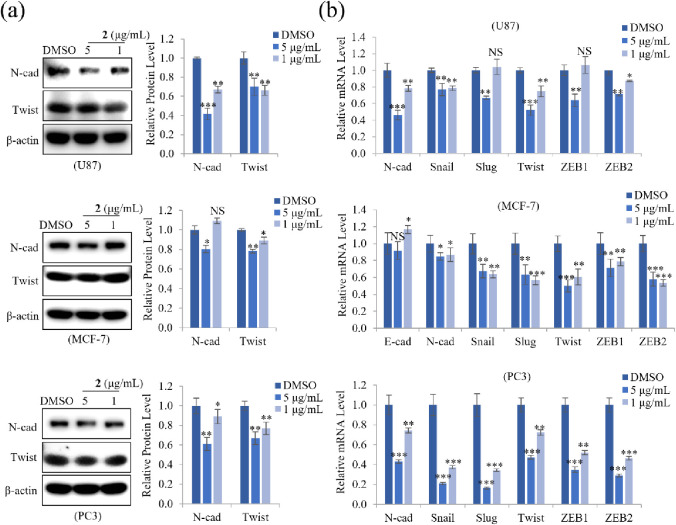
Figure 5.
Effect of 2 on protein and mRNA expression of EMT markers. (a) U87, MCF-7, and PC3 cells were treated with 5 or 1 μg/mL of 2. After incubation for 24 h, the cells were lysed, and the total protein was subjected to immunoblot analyses. Representative images and quantitative analysis of relative protein levels of N-cadherin and Twist in cells treated with 2 show that 2 concentration-dependently reduced protein levels. β-actin was used as a loading control. (b) Relative mRNA levels of EMT markers (E-cadherin, N-cadherin) and their regulators (Snail, Slug, Twist, ZEB1, and ZEB2) were analyzed by qRT-PCR. Data represent the mean ± standard deviation (n = 3 for each group). * p < 0.05; ** p < 0.01; *** p < 0.001; NS: no significant difference compared with DMSO-treated cells.

