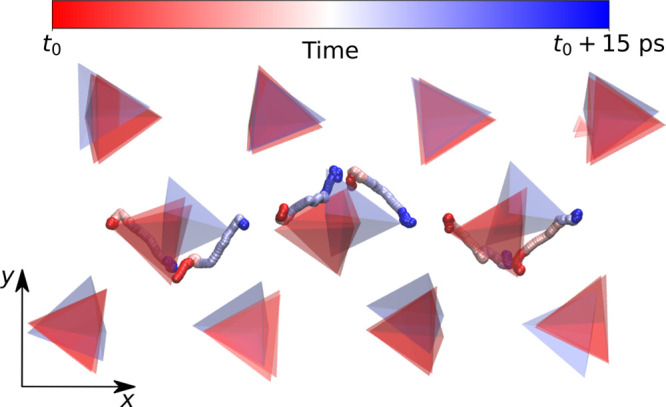
Figure 5.

Transition corresponding to the reorientation of one line of PS4 tetrahedra. Tetrahedra colored red and blue correspond to snapshots of the solid matrix taken over the transition for one trajectory at 750 K starting from the γ structure and run with the ML-PBE0 model. The trajectory of two vertices of each tetrahedron is displayed with lines, that are colored with an RWB scheme and with a smoothening window of 2.5 ps. The red end of these lines corresponds to t0, while the blue end corresponds to t1 = t0 + 15 ps.
