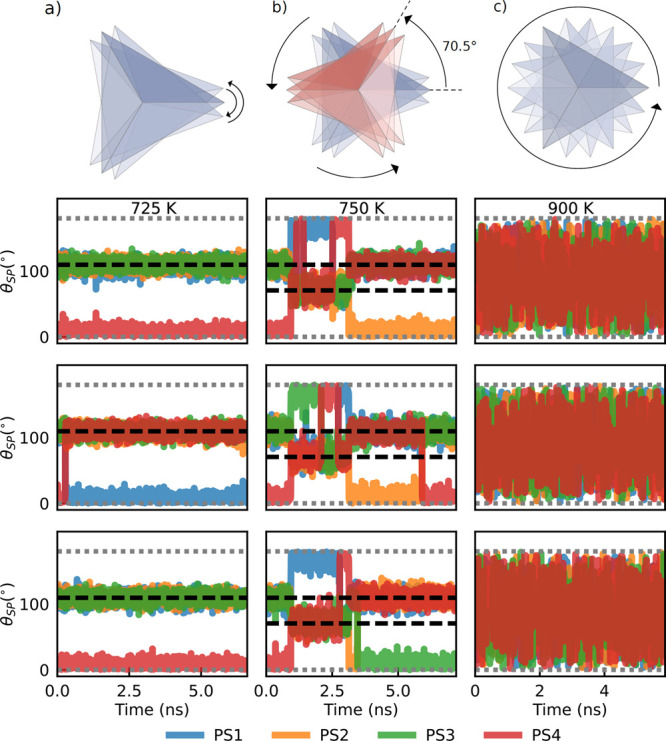
Figure 6.

Sketch of the rotational dynamics of the PS4 groups: low temperature (panel a), where only small librations with respect to the initial configuration occur, at intermediate temperature (panel b) where PS4 flips determine the structural transition observed in Figure 4 and at high temperature (panel c) where the system is melted. The lower plots show the time evolution of the polar angle θSP as defined in eq 1 (angle with respect to the x-axis) for a set of three distinct tetrahedra, forming a [100] row. Each panel represents the dynamics of the four PS bonds forming each tetrahedron. Rows correspond to different tetrahedra, while columns correspond to different NpT trajectories at T = 725, 750, and 900 K. Horizontal dashed black lines indicate the position of the ideal tetrahedral angles at 70.5° and 109.5°, while gray dotted lines mark the extremes of the domain of θSP (i.e., 0° and 180°).
