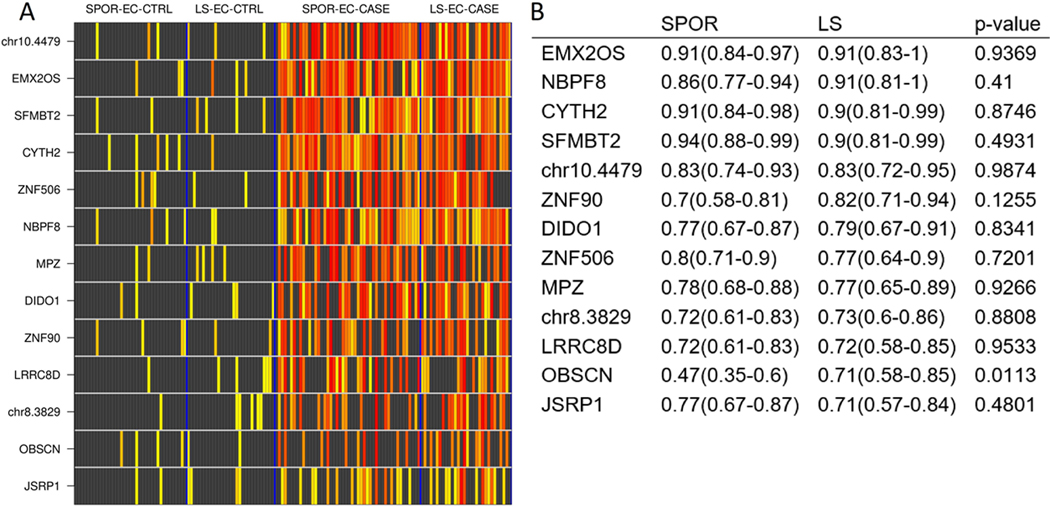
Figure 3:
A.) Heat matrix showing methylation intensity of methylated DNA marker candidates for each endometrial cancer case and control tissue sample. Each row is an MDM quantitative PCR product, normalized to ACTB, and each row is an individual patient DNA sample. Black boxes represent normalized MDM values below the 90%-ile cut off in control tissues (LS-EC-CTRL and SPOR-EC-CTRL benign endometrium, combined); increasing color intensity on the yellow-red spectrum corresponds to increasing deciles of MDM levels exceeding the cut-off. LS-EC-CTRL, Lynch-associated benign endometrium; SPOR-EC-CTRL, sporadic benign endometrium; SPOR-EC-CASE, sporadic endometrial cancer; LS-EC-CASE, Lynch associated endometrial cancer. B.) Corresponding area under the receiver operating characteristics curve values with 95% confidence intervals for each normalized MDM stratified by LS or sporadic status

